In any business, there will be at least one word or metric that has a different meaning depending on which team you’re talking to. As an analyst, it’s your job to ensure that the right people get access to the right data – with the right understanding. Confusion over metrics and what your data platform is really measuring can lead to conflict and ill-informed decisions.
So how do you prevent this?
The answer is to have a data dictionary – a list of key terms and metrics. A data dictionary is a glossary tailor-made for your business!
With PowerBI, a good place to start is to gather a list of all the metrics used by the visualisations in your dashboard. If you try to do this manually, it will take far too long, and will be prone to errors; you’ll either miss a metric entirely or capture metrics incorrectly. But there’s a better way!
The Problem: Capturing every metric from a dashboard manually is too time consuming and error prone.
The Solution: Automate it!

How to Automate your Data Dictionary
- Export JSON from PowerBI Performance Analyser
- Extract field and table names with Python
- Enjoy the time you’ve saved by automating your work!
This guide will help you leverage automated tools to easily build a data dictionary (with the added bonus of enabling you to tidy up your data model by removing unused fields).
After following this guide, you’ll have a clean table of all the fields and measures used in your dashboard – both explicitly and in calculations. To follow along you’ll need to install Python 3 (we recommend installing Anaconda if you’re a bit rusty with Python) and of course PowerBI Desktop (May 2019 or later – this is when the Performance Analyser was added).
The Manual Data Entry Problem
Sifting through every visualisation and calculated column individually is a very time consuming and manual process – and has a high chance of human error. Instead, by using PowerBI’s inbuilt Performance Analyser, you can track all of the tables, measures and fields used in your dashboard’s visualisations.
Exporting this information into a JSON file (it’s one click!) then allows you to query the file easily using Python. Our python code will output a .csv file that can then be opened in a spreadsheet, ready to make your data dictionary, or be directly edited as a text file.
We’re using Python as it is open-source and one of the most versatile and readily available tools. By extracting a JSON file from the Performance Analyser, the analysis can also be carried out on a separate machine to where your PowerBI (.pbix) file lives. You don’t need to worry about any security risks, as the JSON file only stores information about the data model and calculations, without any of the raw data.
Even better, this method will work regardless of whether you are connected to a live data source, a PowerBI dataset, or have your data model stored locally. You also won’t need a Pro license as a user or a Premium licence for your workspace – this approach works no matter where you are in your analytics and PowerBI journey.
By using in-built and open source tools, we’re hoping to provide you with a solution you can implement in any situation with minimum hassle. So let’s get to it!
1. Exporting JSON from PowerBI Performance Analyser
By the end of this section, you will be able to export a JSON file detailing every calculation that PowerBI makes when showing visualisations. To start with, you are going to need to make sure that PowerBI is up-to-date. Download the latest version here. This will allow you to utilise the Performance Analyser.
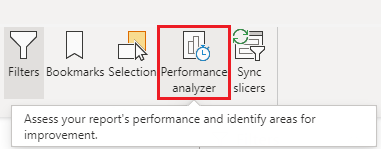
The performance analyser can be accessed by clicking on the “View” tab at the top of the application
and then clicking the Performance Analyser button on the ribbon
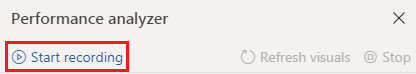
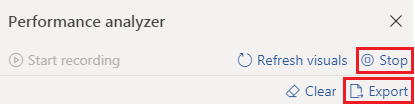
Once your dashboard is open and you have opened the Performance Analyser pane you can start recording. Click on each page/tab of your dashboard, allowing all of the visualisations to load fully before moving to the next page. Waiting for the page to fully load is essential to catch all calculations and fields utilised on each page. (Be sure to also click back to the page you started on, as you need to load each page from scratch).
Once you have all of the recordings made, click Stop. You can now export your entire dashboard’s loading data to JSON format. To reiterate the point made above, only the field names and loading processes will be exported – no raw data is included.
2. Extract Field and Table Names with Python
Extracting data from a JSON File
Now that you’ve got your JSON file ready to go, it’s just a matter of automatically extracting the relevant information.
Once you’ve booted up Python, you’ll need to import the required libraries, all of which come preinstalled with Python 3.
import json
import csv
With that done, run the following to read in the JSON file.
with open("PowerBIPerformanceData.json") as json_file:
 json_text = json_file.read()

 data = json.loads(json_text[json_text.find("{"):])
The use of the find() function on line 3 is to trim off any special formatting characters that may have been added when exporting from PowerBI.
The JSON format works by storing data in a hierarchical key:value structure. To access the relevant information in the data structure, we will need to repeatedly call the appropriate keys at each level.
At the top level of this particular JSON structure, we have the key “events”, which points to a list of all the events that PowerBI’s Performance Analyser recorded. Each event has a field called ‘metrics’, which among other things, stores the DAX Query used to generate the object. We can analyse these queries to extract all the fields and measures used.
The following two lines extract the Query Texts for each object, and store them in a list.
metrics =  for event in data['events'] if 'metrics' in event]
query_texts = [metric['QueryText'] for metric in metrics if 'QueryText' in metric]
We can now loop through the query texts and extract each field used along with the table it comes from.
Saving your output
Start by creating and opening a .csv file to write your fields to:
csvfile = open("data_dictionary.csv", "w+", newline="")
Here we’ve named the file data_dictionary, but you can name it however you like.
Create a Writer object to write new lines to your csv file, and create a header row.
writer = csv.DictWriter(csvfile,
    fieldnames=["table", "field"])

writer.writerow({"table": "Table",

       "field": "Field"})
Next, create a list to store the fields as they get written to the csv file, to avoid duplicating rows.
recorded_fields = []
Now you can loop through all the query texts, and extract the fields used, and their respective table names.
This is done here by splitting each query by the string segment ‘[ (that is, apostrophe + left square bracket). This is to identify all the substrings that refer to a field from your data. From there, the field name can be extracted by finding the first right square bracket after the string segment, and the table name by finding the first apostrophe before the string segment.
This works because each field used by PowerBI is always called in the form ‘TableName’[FieldName]
for query in query_texts:
 query_split = query.split("'[")


 for i in range(len(query_split)-1):

  newrow = {"table": query_split[i].split("'")[-1],

                      "field": query_split[i+1].split("]")[0]}


  if newrow not in recorded_fields:

   recorded_fields.append(newrow)

   writer.writerow(newrow)
Lastly, don’t forget to close the Python connection to the csv file.
csvfile.close()
You can download the full python script by following this link.
3. Enjoy the time you’ve saved by automating your work
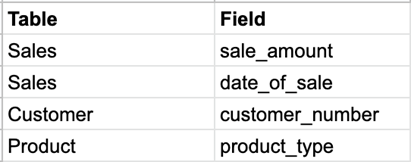
Your data dictionary is now automatically filled with every table and field used in your dashboard. By using built-in and open-source tools, we’ve given you a solution that will work on any project, that also eliminates the chance of human error.
So now you can kick back and relax. Our Python script is open-source too, so we’ll even let you take the credit 😉 If you want to find out how else we can save you time and improve your data practises, feel free to contact us.
Happy scripting!
