Published September 5, 2021
Written by Mark Boongaling

The situation
Continuing the success of our collaboration with the Northern Territory Department of Education (NT DoE) on the eDash platform, Mantel Group’s data team and NT DoE developed a suite of additional dashboards for the eDash platform that aimed to support both corporate and school-based users. These dashboards measured student academic improvement as well as user engagement and retention of students over time.
One dashboard in this suite targeted a student assessment. The analytics highlighted participation in early childhood literacy, which focused on phonological awareness and the grasp of the alphabetic principle. The assessment allowed schools and the department to better identify specific gaps in foundational literacy skills that and the need of extra teaching support for individuals
The approach
Our approach focused on applying design thinking concepts including empathy mapping and iterating on low-fidelity prototypes prior to technical development. This approach ensured we were identifying key pain points and iteratively validating the eventual solution to the problem.
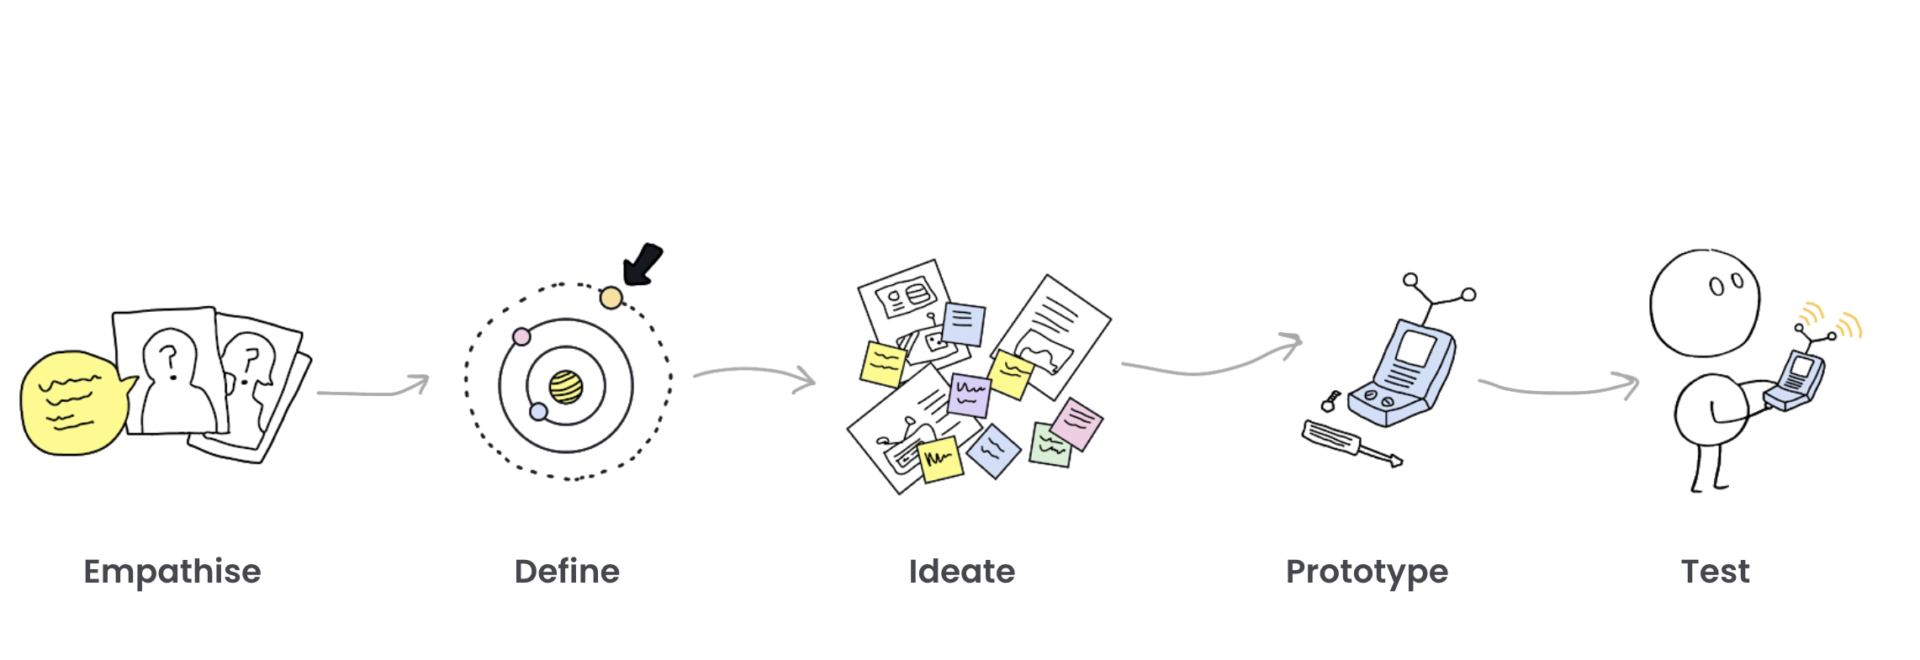
During the discovery phase at the beginning of this engagement, we scoped out the primary pain points across the team by conducting interviews and facilitating workshops with the team members responsible for analysing and coordinating the early childhood literacy assessment.
Generally, the core problem was the following: “In order to get a snapshot on who has completed the assessment, we manually collate this information periodically. This is a long process as our existing system only reports one school at a time.”
Following this realisation at the heart of the problem, the eDash team drafted low-fidelity prototypes on Adobe XD addressing the issue. This was key to its success as we were able to iterate quickly on how to best represent current assessment participation whilst developing the backend solution to bring the necessary data in for the eDash platform.
Once the prototype was confirmed, the eDash team was able to build the working prototype for pilot users who provided feedback to Mantel Group. The key teams acting in the pilot group tested the dashboard by using the data, as if production-ready. The eDash team assisted Mantel Group in refining the details up until the official production release of the dashboard to the wider audience.
The solution
The solution for NT DoE focused on a complete understanding of the primary DoE pain points while developing the dashboard. The use of data analytics and design thinking to accomplish these goals in parallel was key to delivering appropriately for eDash. Through iteratively improving a low-fidelity prototype with the key team members responsible for the literacy assessment, we proceeded to build the working prototype.
The solution had a primary focus on consolidating multiple schools in one visual solution whilst leveraging the existing SSAS data model that connected to live data in the data warehouse. We encouraged specific users to use the assessment dashboard, as if it was the final product. The developing dashboards were available to these pilot users for feedback as a significant aspect of the full solution offering. This was critical to the overall success of this project since it drove the dashboard iteration.
Assessment Current Participation
Aginic Playground Link: School and System Level Assessment Tracking
Disclaimer: The data presented in the demo is generated and it does not contain any real student information.
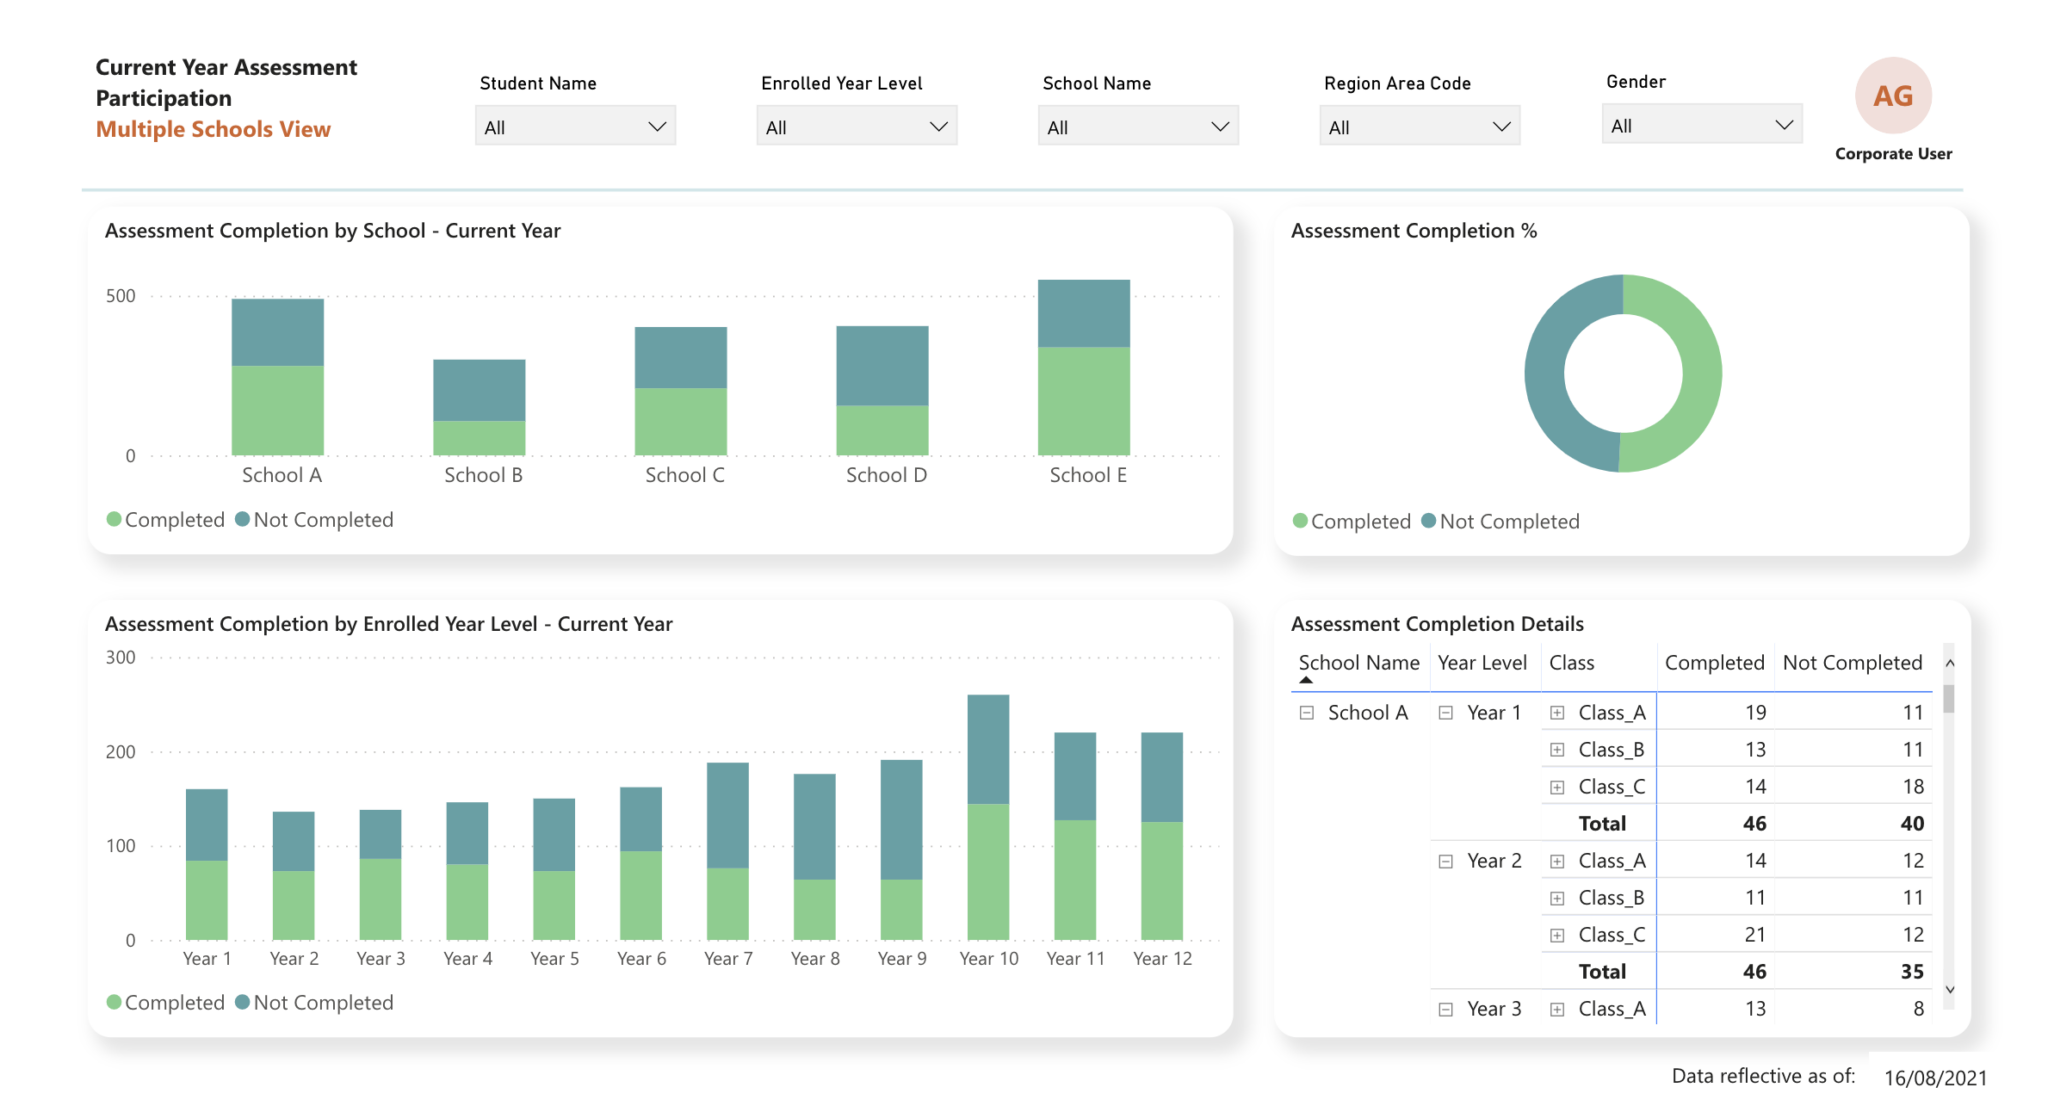
The demo dashboard provided a simple view of the progress on assessment participation detailing how many students had completed the assessment this year as well as those who hadn’t, divided by school, year level and the total selected cohort.
The eDash dashboard participation dashboard displayed a key performance indicator (KPI) detailing the total number of students in the first year level of full-time schooling (Transition within NT education) who had completed versus those who had enrolled, as the assessment was mainly administered to these students.
In addition to the high level summary pictured, the dashboard was able to detail who had and had not been assessed, allowing teachers and school support staff the ability to keep track of assessment administration.
Assessment Current Participation | Security
Schools who access this dashboard today are restricted to data for students currently enrolled in their school whilst corporate users who are permitted to see multiple schools can see participation across those schools. The dashboard is built with both school and corporate users in mind, thus additional high-level groupings are included that combine schools together, i.e. district areas or network areas.
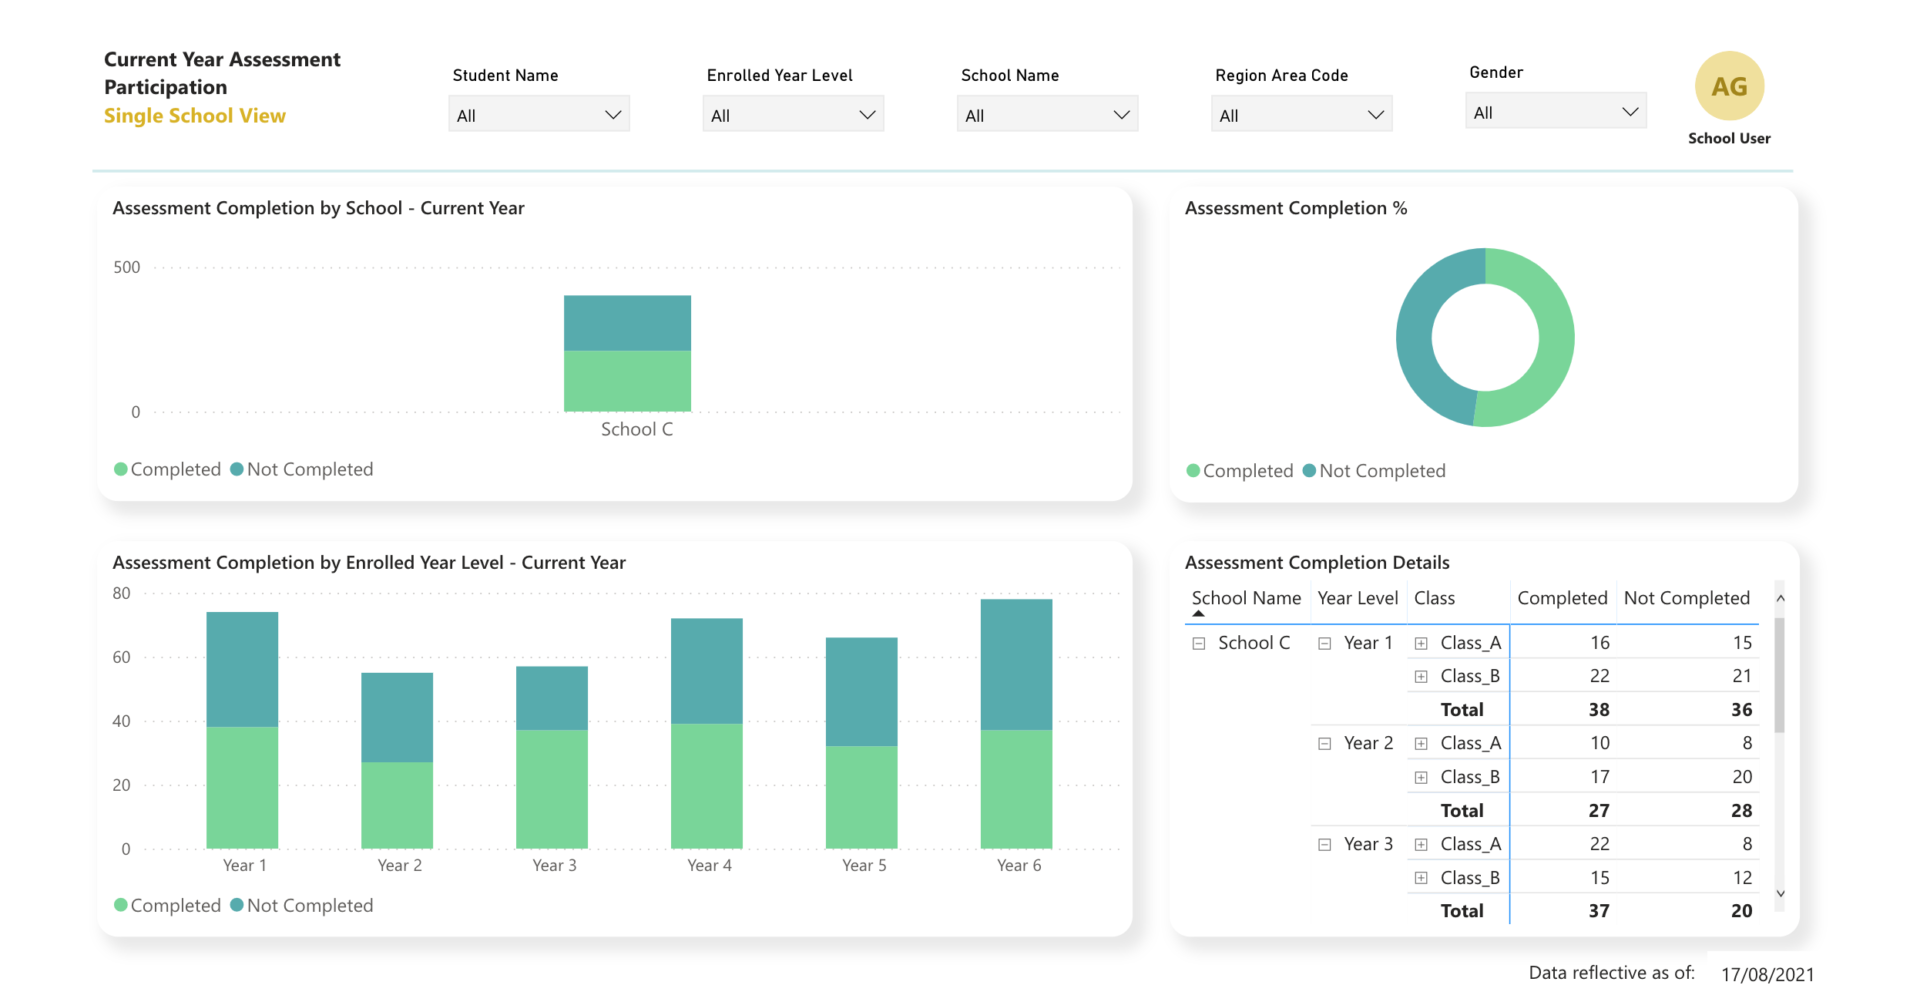
Single School View for a School User
Business outcomes
The early childhood literacy assessment participation dashboard helped teams in realising operational efficiencies and assisting teams in better supporting schools to increase overall assessment participation. NT DoE were able to increase assessment participation in 2020 and the 2021 participation target has already been superseded (as of July 2021).
Organisational Efficiency
The dashboard facilitated continual and live monitoring of student assessment participation and can be viewed by both schools and corporate. The eventual outcome of this dashboard saw a shift in practice for corporate teams where eDash was used as a supporting tool to monitor and follow up with schools on the assessment, enabling greater engagement and compliance.
Operational Efficiency
The dashboard promoted operational efficiency as the manual effort to collate the information was automated and was presented in a single dashboard. The selection filters enabled users faster interrogation of the data and the shared eDash platform promoted conversation and clarity for both corporate and schools.
Design Thinking
Applying elements of design thinking enabled clear direction on what the core problem was and enabled faster cycles of feedback from an engaged audience prior to real development. The preliminary work became essential in streamlining development and eventual production release.
