
With a 65 year history, Blue Care is one of the largest aged-care providers in Queensland. A team of 8,000 staff provide more than 3 million visits a year to empower older Queenslanders to live life their way. Hear how data driven decision making changed the way they worked, for good.
The Client
With a 65 year history, Blue Care is one of the largest aged-care providers in Queensland. A team of 8,000 staff provide more than 3 million visits a year to empower older Queenslanders to live life their way.
The Challenge
In 2017 government deregulation pressed the aged care sector into a more competitive and uncertain environment. At Blue Care, Ben Moore recognised that data-driven decision making was central to meeting this challenge, but the existing technology made it difficult to access and use data. “We were trying to pull manual reports out of Procura to understand nothing more sophisticated than how many clients we had week to week,” said Ben. “[Staff] would literally spend the better part of a day a week trying to compile those numbers and they would look different every week. We needed a dashboard for this, and that’s where [Mantel Group] came in.”
The Solution
In the first tranche of work, Mantel Group delivered simple overview dashboards showing how many clients were enrolled in each service type, and how this was changing. The response from the wider business was immediate and positive. “‘Oh my god, this is amazing,’” recalled Ben. As more users viewed the dashboards, new ideas and wish lists started to emerge. Additional pages were added to the overview, increasing the information about how funding was being spent for individual clients, and who was enrolled in what level of care. “For me the surprise has come from the power of visualising the data. We had traditionally only had flat reports, so no ability to drill through, no ability to visualise, no real ability to interrogate through the hierarchy of data. The surprising thing to me was how powerful that is.”
Over two years, subsequent engagements transformed these simple dashboards into a broad suite of dashboards aimed at several groups of users. Today, a service provider can view a dashboard to see details of their individual clients’ care, and check that funding is being spent on the services that provide the best health outcomes. Dashboards allow service managers to compare and balance the workloads of service providers, which has been good for clients as well as staff morale. Most importantly, the complex financial gymnastics associated with mixed government and private funding can now be easily visualised in a single dashboard. This gives oversight into possible areas of overspending, and helps ensure Bluecare will be a sustainable care provider into the future. “My hope is that we’ve planted the seed now for them to understand the power of the data, and using it well. My hope is that they use that as a building block and take it a lot further.”
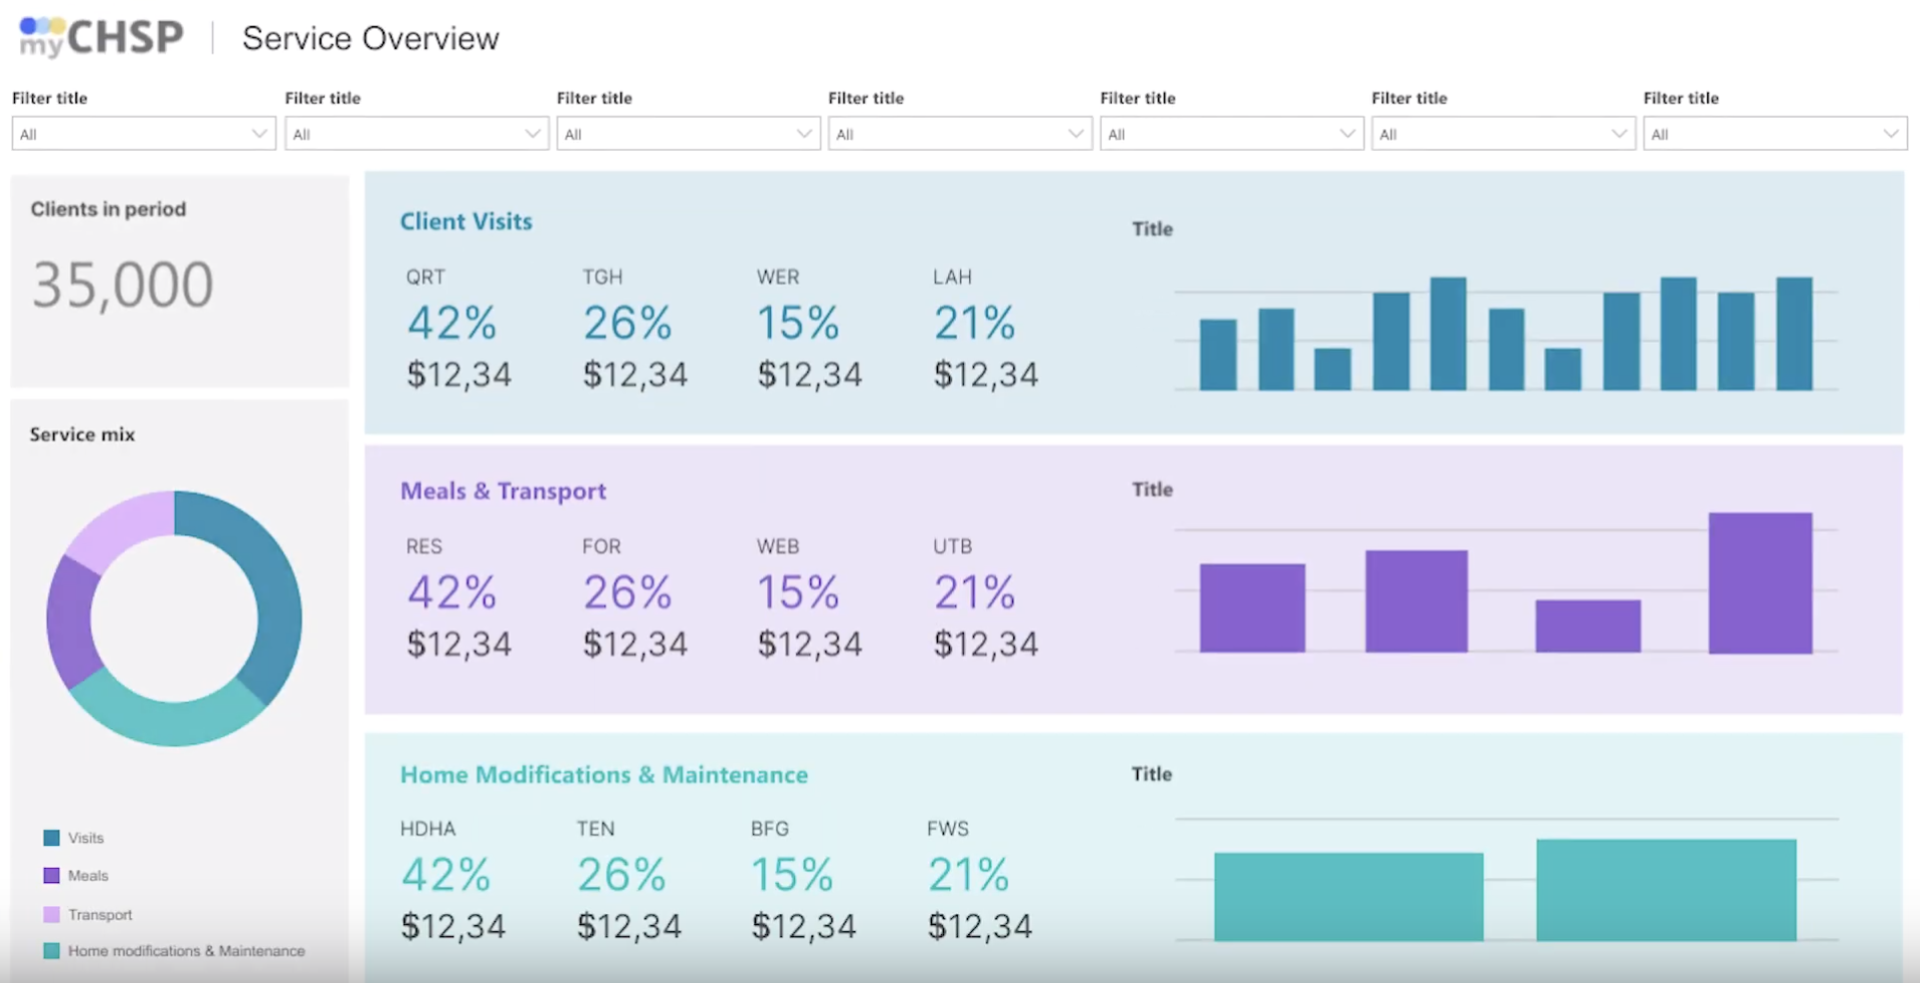
Image: Mock-up dashboard showcasing the example service overview dashboard detailing service volume and key business metrics.
”…we would literally spend the better part of a day a week trying to compile those numbers and they would look different every week."
The dashboard transformation was accompanied by a transformation in the value and use of data within the business. Business Change Manager Kattral O’Sullivan comments “One of the underlying philosophies is that we’re trying to encourage using data and empirical evidence for making business decisions.” Ben agrees that the process has been successful in this direction, and has also rippled out into other parts of the business. “A lot of the other work we’re doing has started to lean on the dashboard development to help them with the KPIs and business reporting and targets and stuff that we otherwise wouldn’t have had. That allows us to help drive benefit into other initiatives that we might not have expected.”
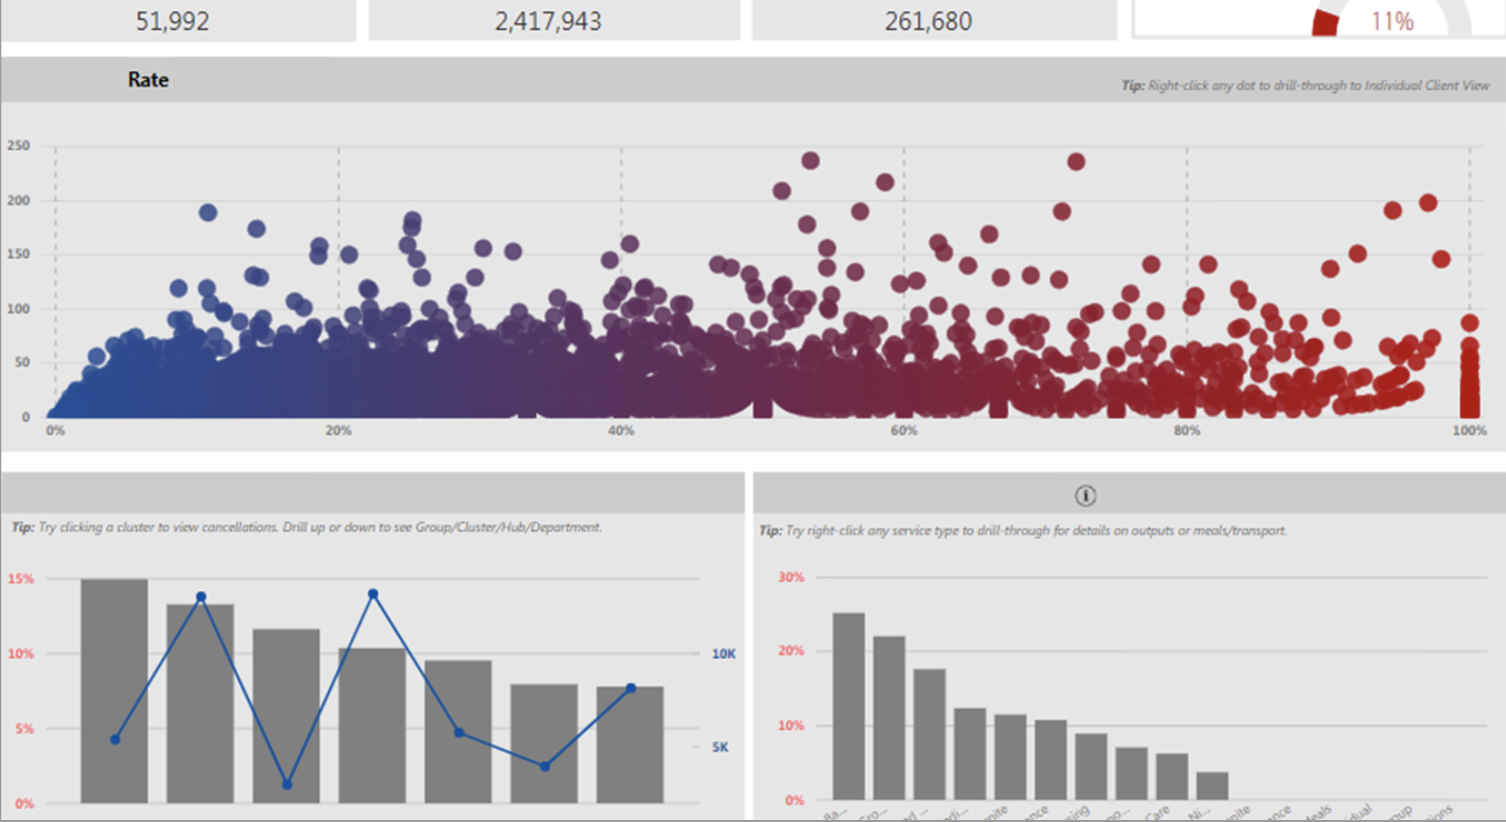
Image: Anonymised dashboard provides an understanding on cancellation rates across individual patients and different service categories.
The transformation at Blue Care was made possible by a seamless blend between the Blue Care team and the Mantel Group developers. The group met as one team for daily standups onsite at Blue Care, which allowed the developers to ask questions and the business experts to provide feedback, validation and requests. Fortnightly showcases fostered engagement with the wider business. This meant that by the time the dashboards were rolled out across the business, care providers as well as management staff had seen the dashboards and shaped their direction.
Continuous improvement is a cornerstone of our work, and was very important to the Blue Care team as well. “The thing I’ve enjoyed the most is that we’ve continued to improve, and I think we’ve done that together,” says Ben. “The partnership with you guys has worked really well because what we have is quite a lot of expertise about how this business works, and what data is available, but what you guys have shown us is a whole bunch of new and interesting ways with how we actually present that back to the organisation.”
”I don’t think I’ve ever had such an easy, seamless relationship with a vendor, and one that’s gotten such great results. This has been my favourite thing that I’ve done since I’ve been here. You guys and your attitude to the work has enabled it."
Published November 5, 2019
