Written June 16, 2022
The Market Insights team at Wine Australia needed a tool to present and filter information to give grape and wine businesses the information they needed to make informed decisions. We worked with Wine Australia in a cross-functional team of data analysts, designers, data engineers, front-end web developers and delivery leads. Together we collaborated to create user-centred dashboards that are publicly available on their website.

The situation
Wine Australia’s Market Insights team plays a key role in analysing key data sets and disseminating information to the Australian wine sector, which incorporates approximately 2100 wineries, 6000 grape growers and 1200 wine exporters. Each group of stakeholders has diverse needs, making it challenging for Wine Australia to successfully disseminate helpful insights to all businesses. The Market Insights team needed a tool to present and filter information to give grape and wine businesses the information they needed to make informed decisions.
Wine Australia needed specific features in the Power BI dashboard, including public-facing embedded analytics in websites, data downloading, printing to PDFs, availability on mobile and a strong visually appealing design.
The approach
We worked with Wine Australia in a cross-functional team of business and data analysts, designers, user experience gurus, data engineers, front-end web developers and delivery leads.
We utilise Agile practices at Mantel Group, and the development of the Wine Australia dashboards followed the Scrum framework. Each sprint started with a planning session where we agreed on the goals and priorities. The sprint involved daily stand-ups with all development teams, backlog refinement sessions and sprint reviews to showcase the incremental value presented back to stakeholders for feedback.
Before starting development, we collaborated closely with Wine Australia through a series of discovery activities, including a vision and objectives workshop, design thinking and UX workshops, way of working sessions and backlog creation. This suite of workshops was integral in laying out the foundation for the project roadmap.
User testing was conducted using a high-fidelity interactive prototype created in Figma. This tool allowed users to get the feel of the dashboard early in the piece without needing to wait for the build of pipelines or dashboards.
A demonstration of our high fidelity protoype created in Figma.
The user testing culminated in a final sprint that focused on improving the performance of the dashboards without adding any new features. We discussed goals and priorities and agreed on expectations of performance for the final dashboard. The final sprint re-created the data model and visualisation aspects of the dashboard to maximise performance.
The solution
The product of this project included two external facing dashboards developed using Power BI and embedded into Wine Australia’s website using Power BI embedded. Microsoft Azure was the cloud platform used with Azure Data Factory taking care of the data flow and triggers, Azure Data Studio to write SQL transformations and Azure DevOps for source control.
The National Vintage Survey (NVS) Dashboard displays data collected by Wine Australia regarding the tonnes and value of grapes grown, purchased and crushed by Australian wineries each year. The dashboard provides information about crushed grape volumes and pricing by state, region, variety (e.g. Shiraz, Chardonnay, etc.) and time trends, in order to guide decision-making for growers and purchasers.
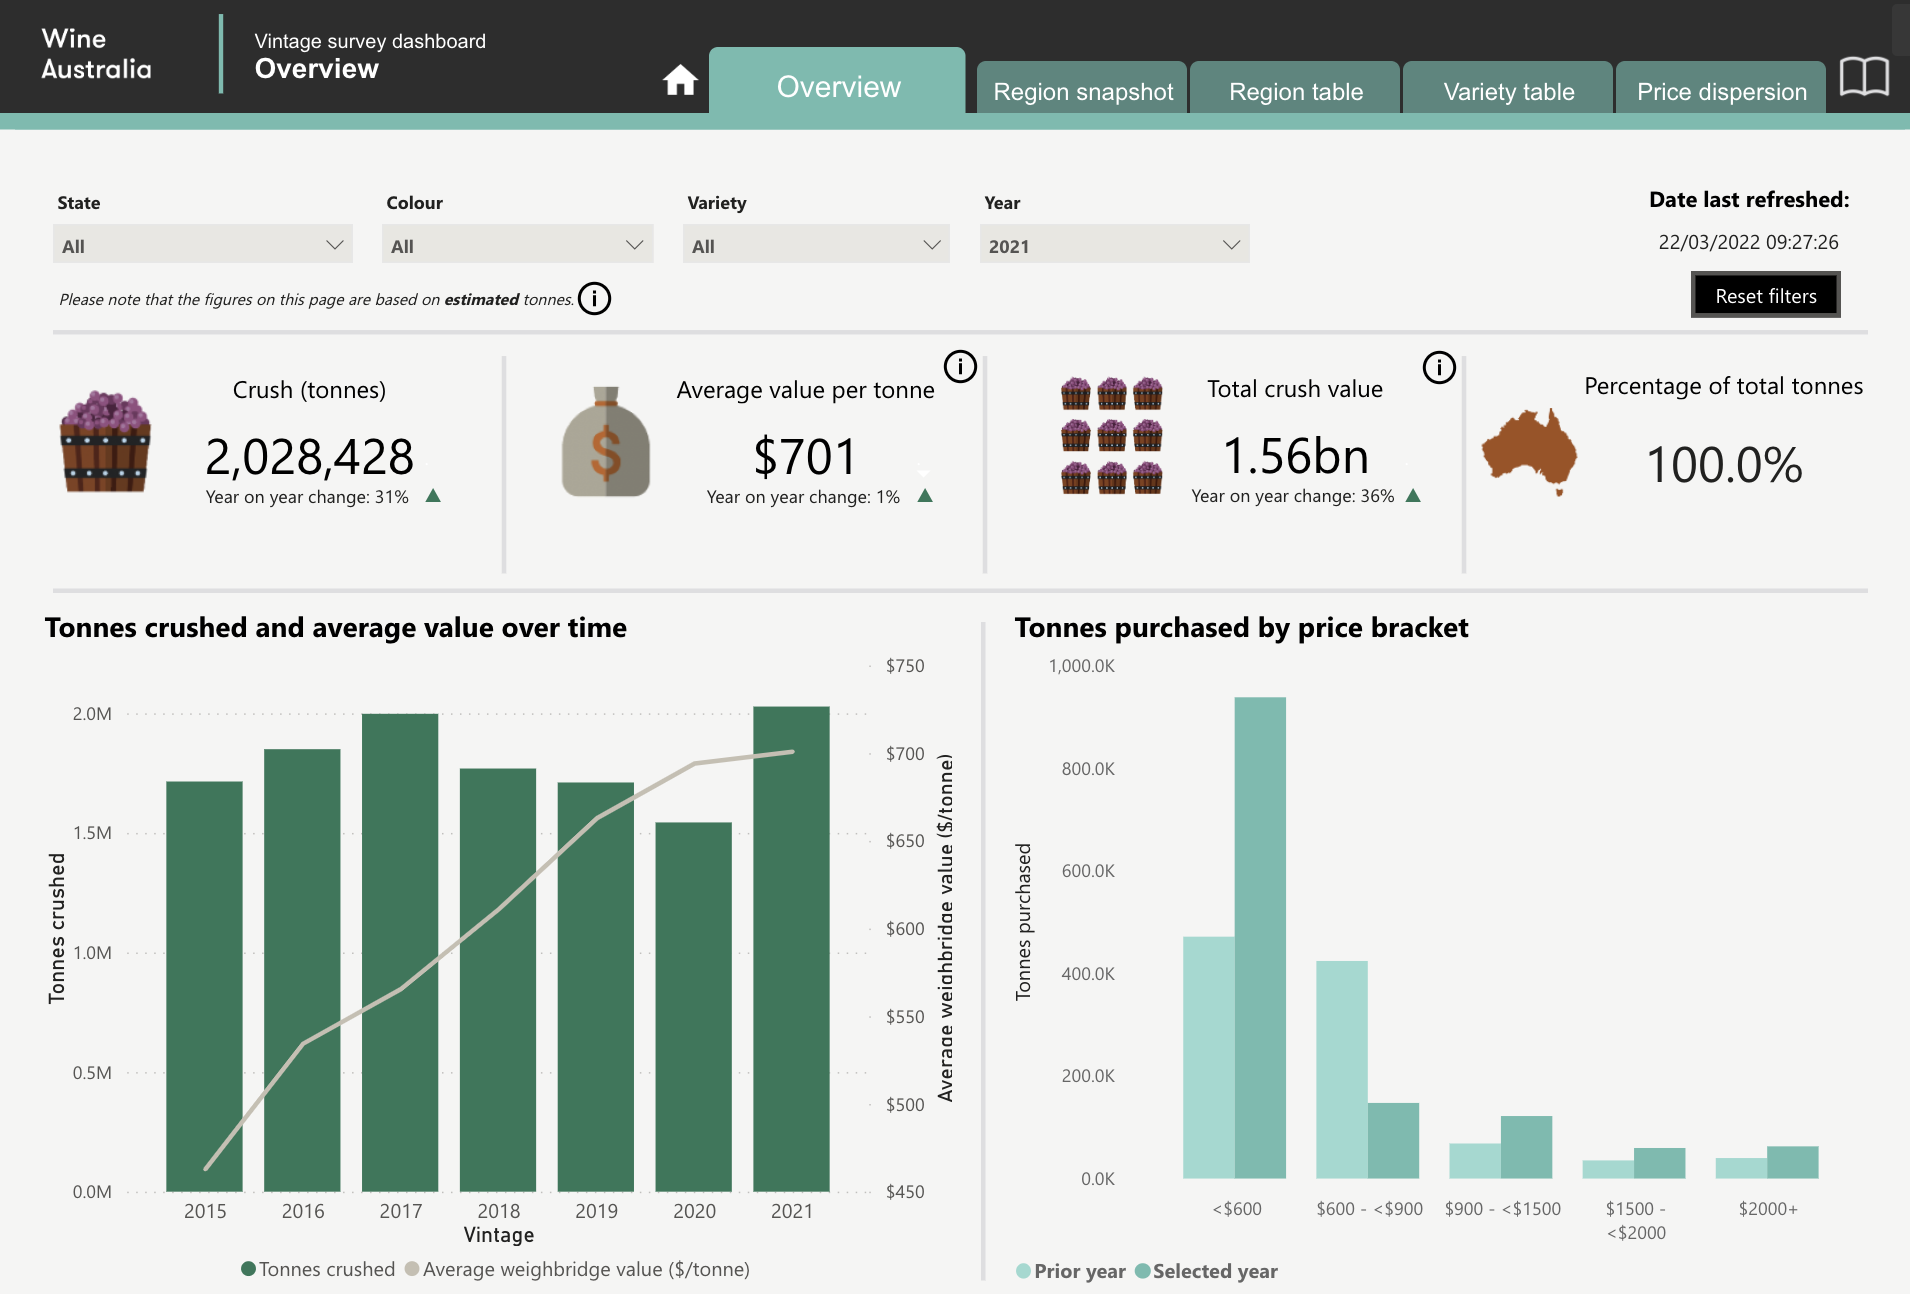
View the live National Vintage Survey dashboard: https://marketexplorer.wineaustralia.com/vintage-survey
The Export Dashboard collates data from the Wine Australia Licensing and Approval System – released quarterly – that reports Australian wine export data by market destination with fields including variety, label geographical claim and price points. This information is presented in an overview format with a toggle that switches the data to be viewed by volume or value. Users can then analyse Exporter Profile data, which shows the number of exporters and volume or value of wine exported by size of exporter (groups by cases).
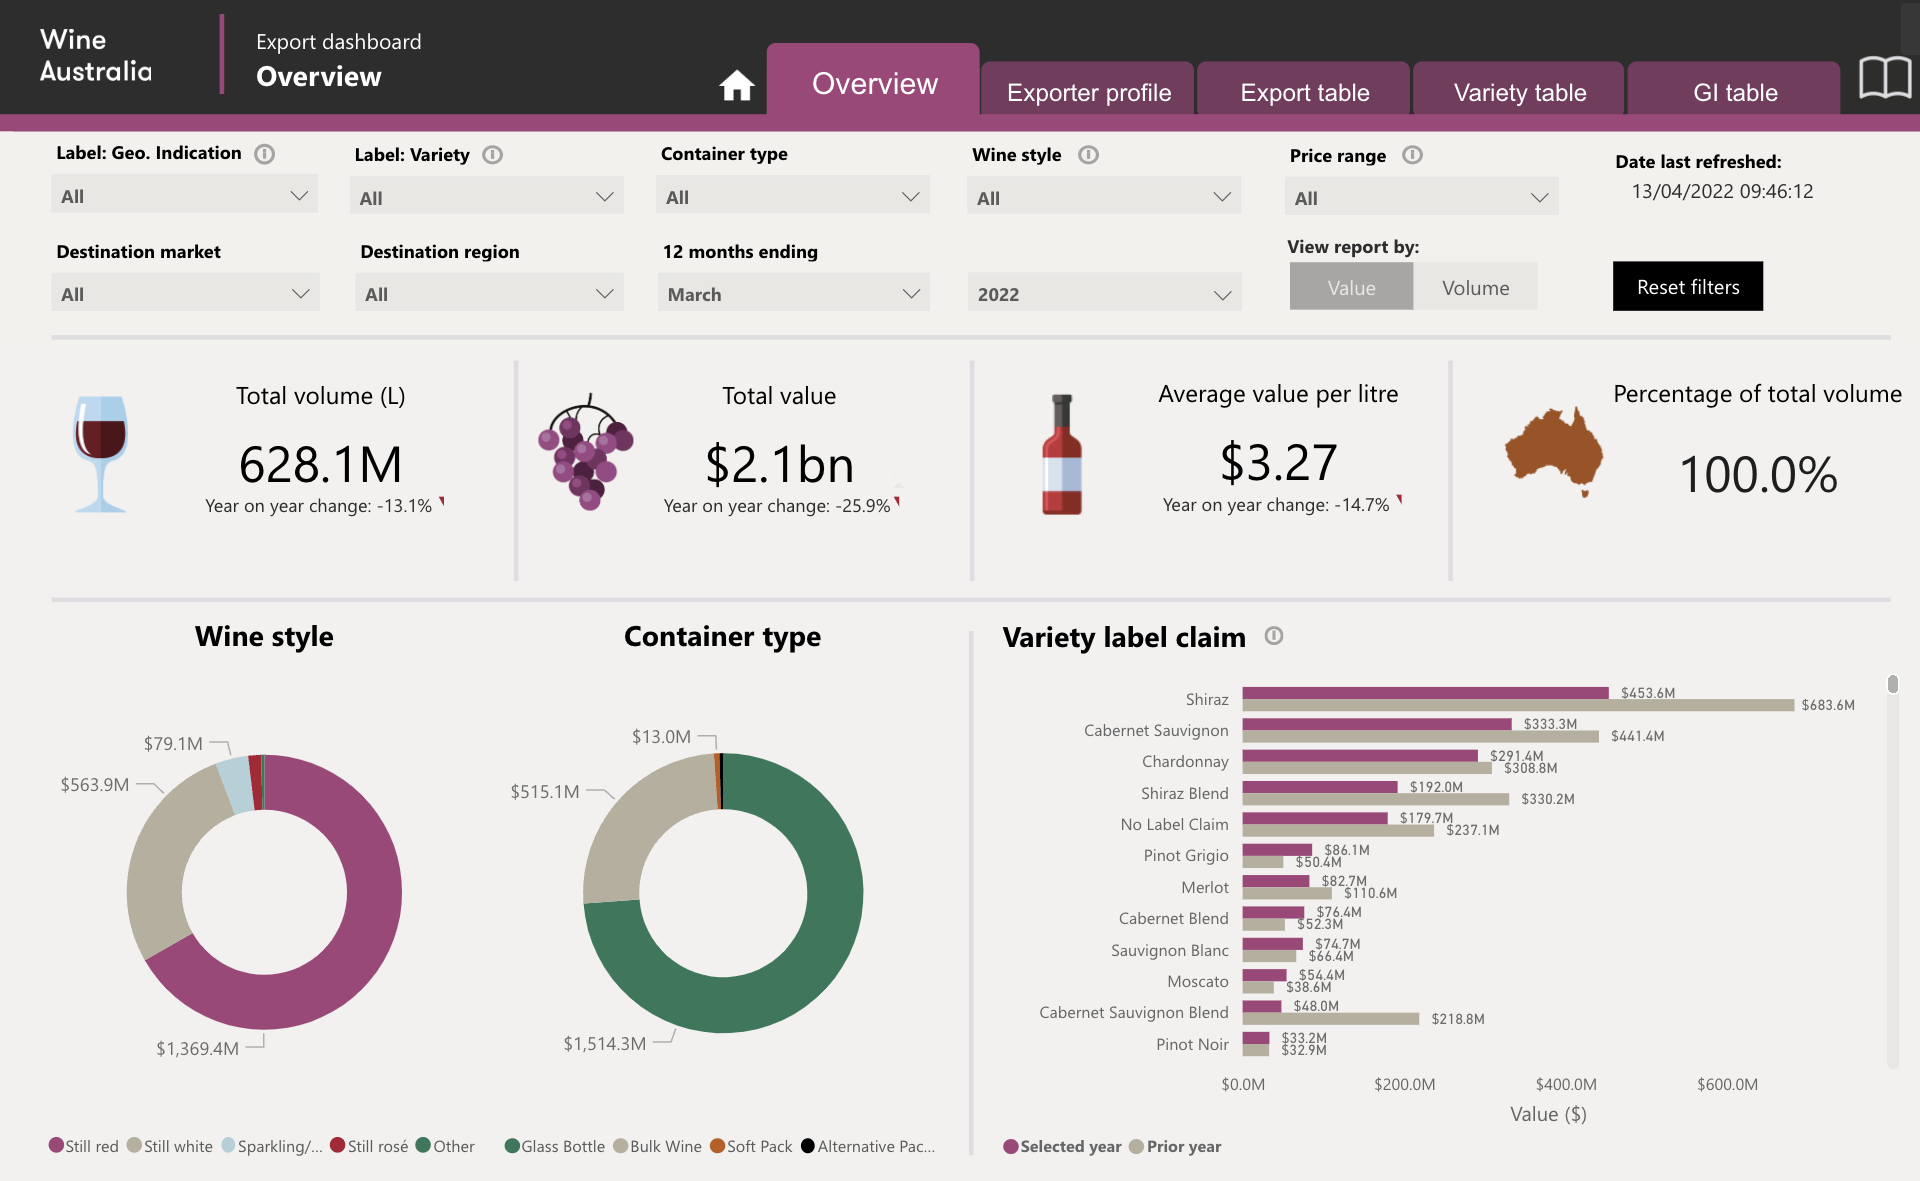
View the live Export dashboard: https://marketexplorer.wineaustralia.com/export-dashboard
The dashboard for the export and National Vintage reports required a combination of a complex set of SQL transformations and dynamic DAX formulas built in Power BI. The grouping of exporters by size required a dynamic calculation based on the dates selected in the filter where grouping is by year end.
Business outcomes
Wine Australia has been using the dashboards for more than 12 months to enhance access to its reporting data. The platform is accessible 24/7 and is publicly available with no login required, making access quick and easy, so grape and wine businesses can find facts and trends to make informed business decisions. The dashboards have the flexibility to provide both high-level overviews while also allowing greater access to the detail within the datasets.
Through the dashboard’s automated analysis and calculations, Wine Australia now has a greater ability to focus efforts on understanding markets and the decisions that need to be made to support grape and wine businesses.
Feedback
Since this engagement, we have worked with Wine Australia in an advisory capacity across its entire data analytics platform.
”“We have found [Mantel Group] to be responsive, and for a small in-house IT team, their ability to support us has been second to none. We consider the [Mantel Group] team an extension of our own, helping with options analysis, process improvements and technical decisions.”
– Karen Fairbrass IT Manager
