
Databricks is one of the major players in the data space, but some people may still treat it like an optimised hosted service of Apache Spark. It’s true that Spark on Databricks is more optimised than its open-source brother, but this is not the end of the story. Databricks offers a set of tools and features to improve the development experience of a data engineer and also to increase their productivity, because that means more DBUs spent on the platform. In this post, we will cover some of the things you can do on Databricks that you might not be aware of. The focus here will be on the data engineering workloads.
Source code of this post is shared here . The examples in this post are done on a Databricks cluster hosted in AWS with Databricks runtime 11.3.
Notebook and Usability Tips
Display function
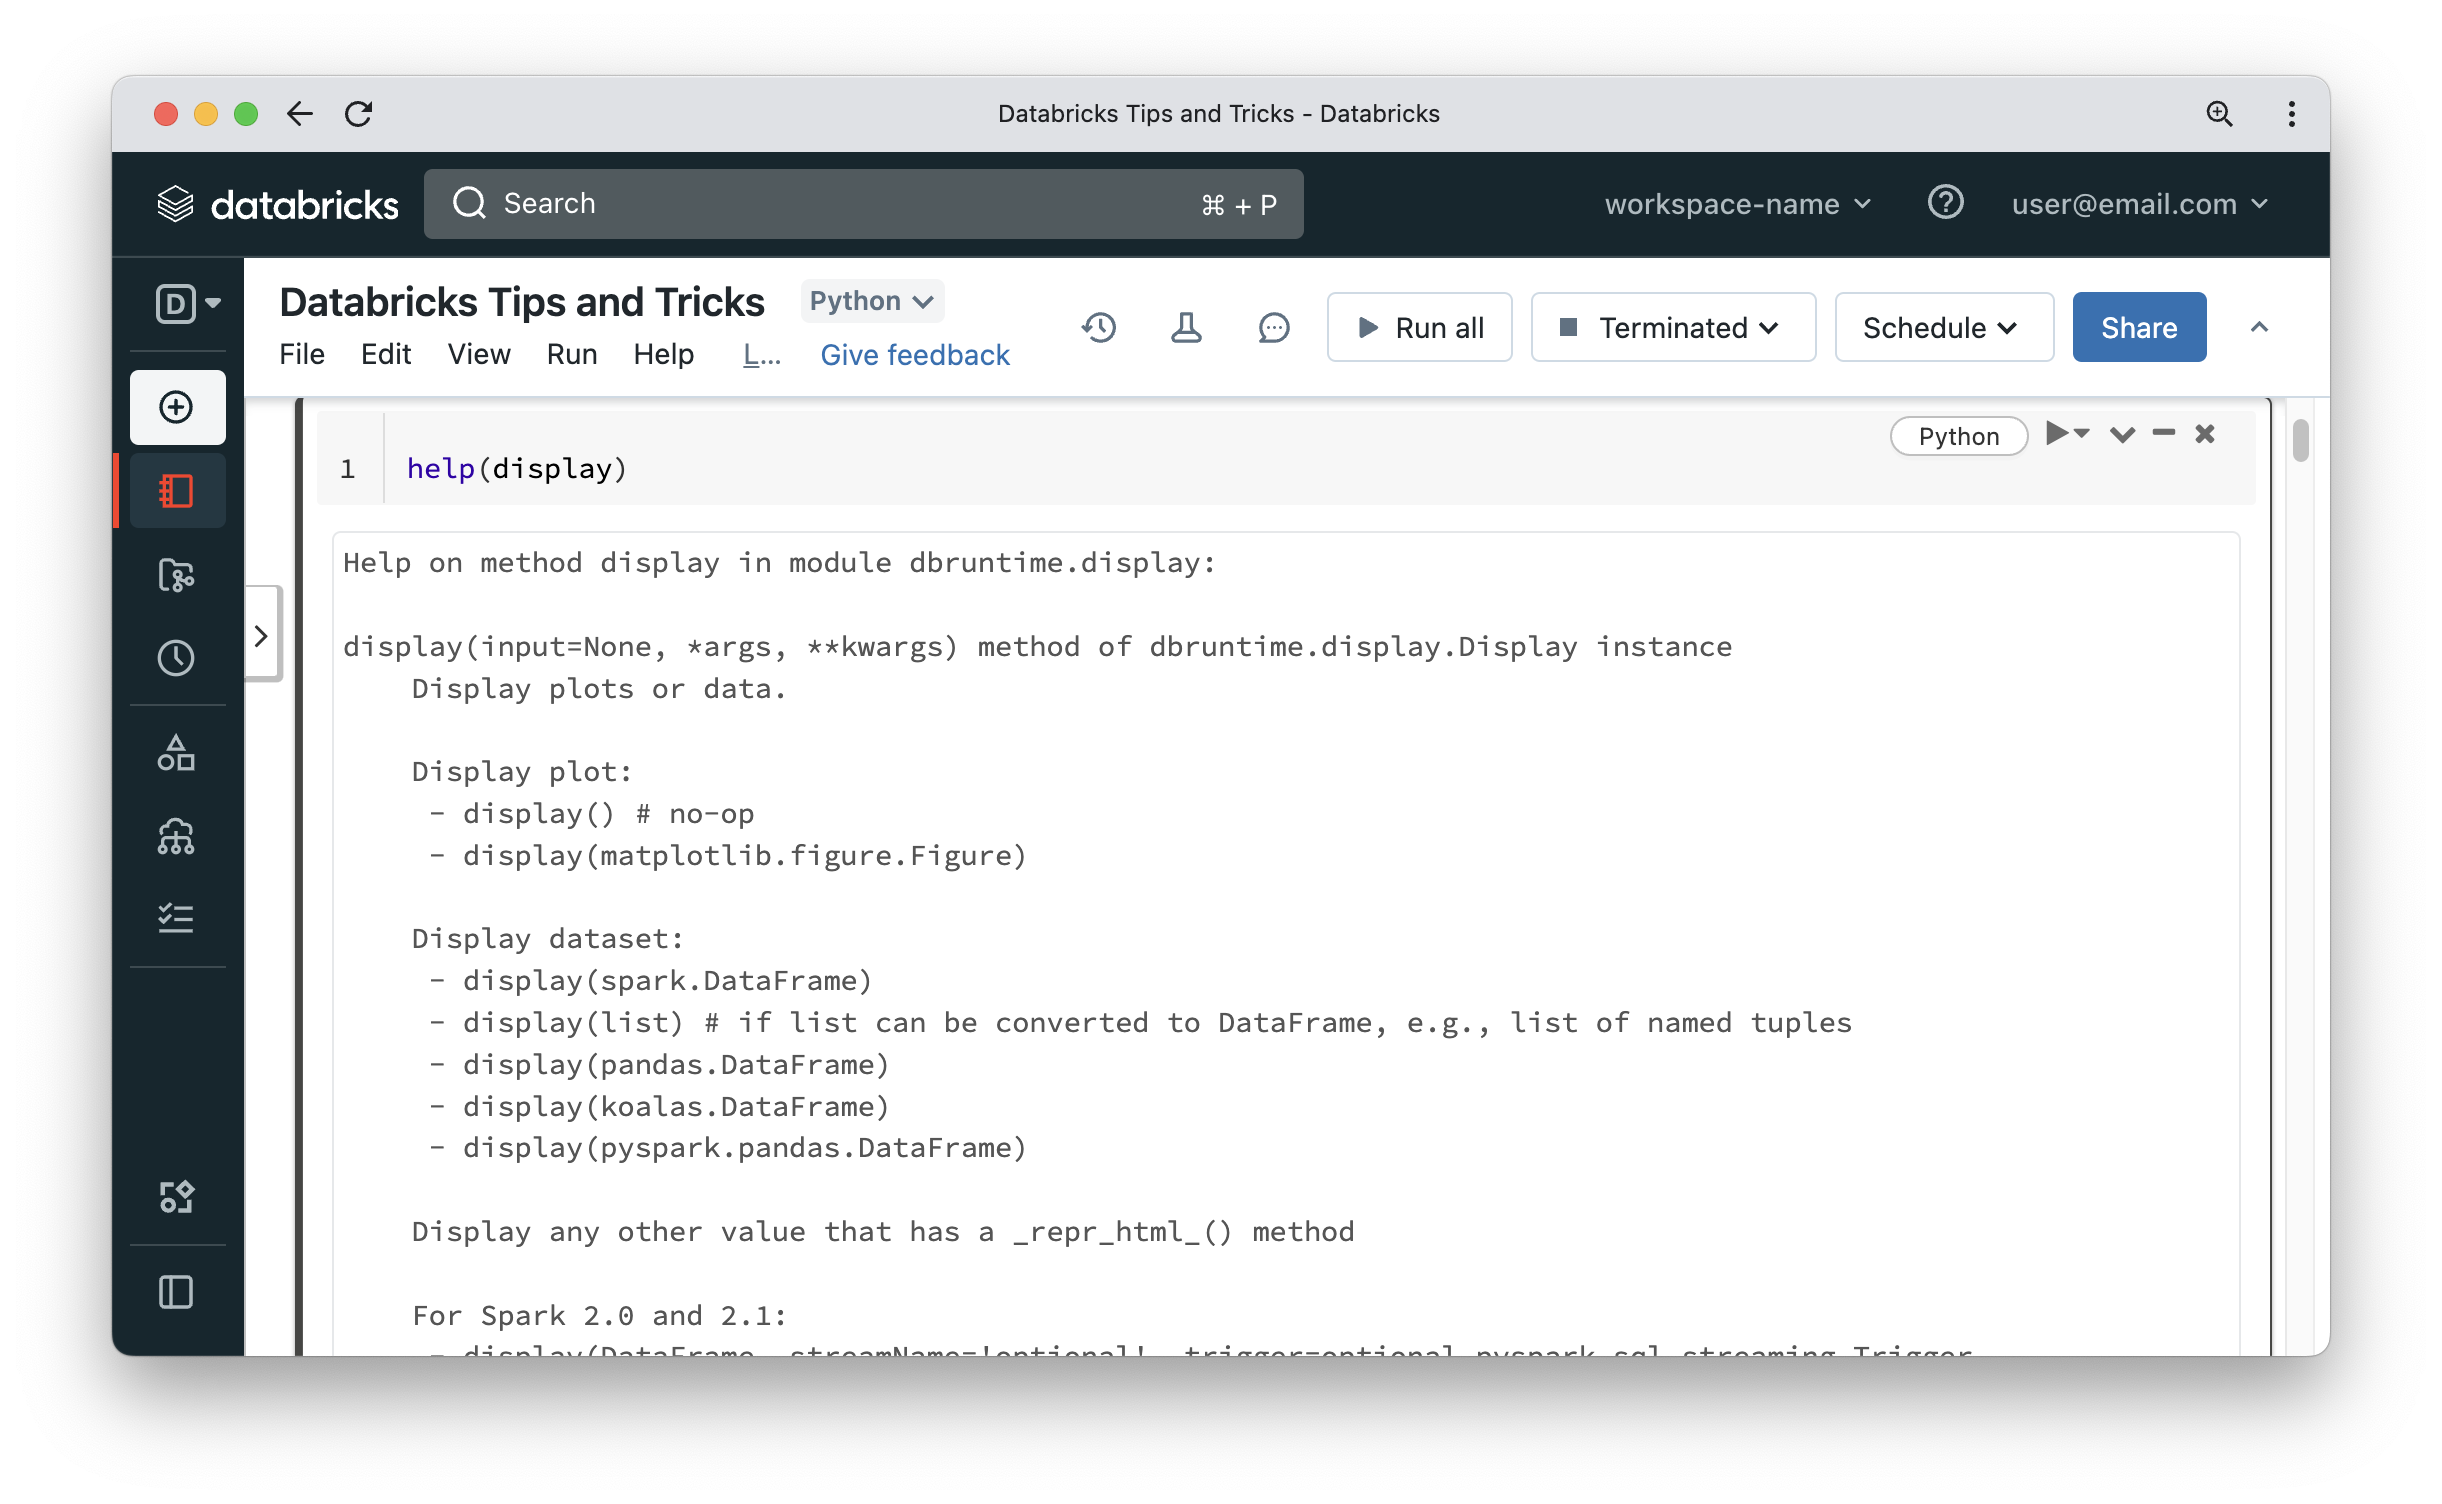
All Spark developers are familiar with DataFrame show function. It works well but has problems with word wrapping and even if you use it in a notebook, you cannot do things like sorting output or exporting the result to a flat file format. Databricks has a display function that can take a Dataframe as input (or be called on a DataFrame object) and produces a formatted tabular output which can be sorted and exported. If you explore the documentation of said function, you will notice that it can even handle any list that can be converted to a DataFrame, meaning as long as the objects inside the list have consistent named properties, the function can create a DataFrame on the fly and display it too.
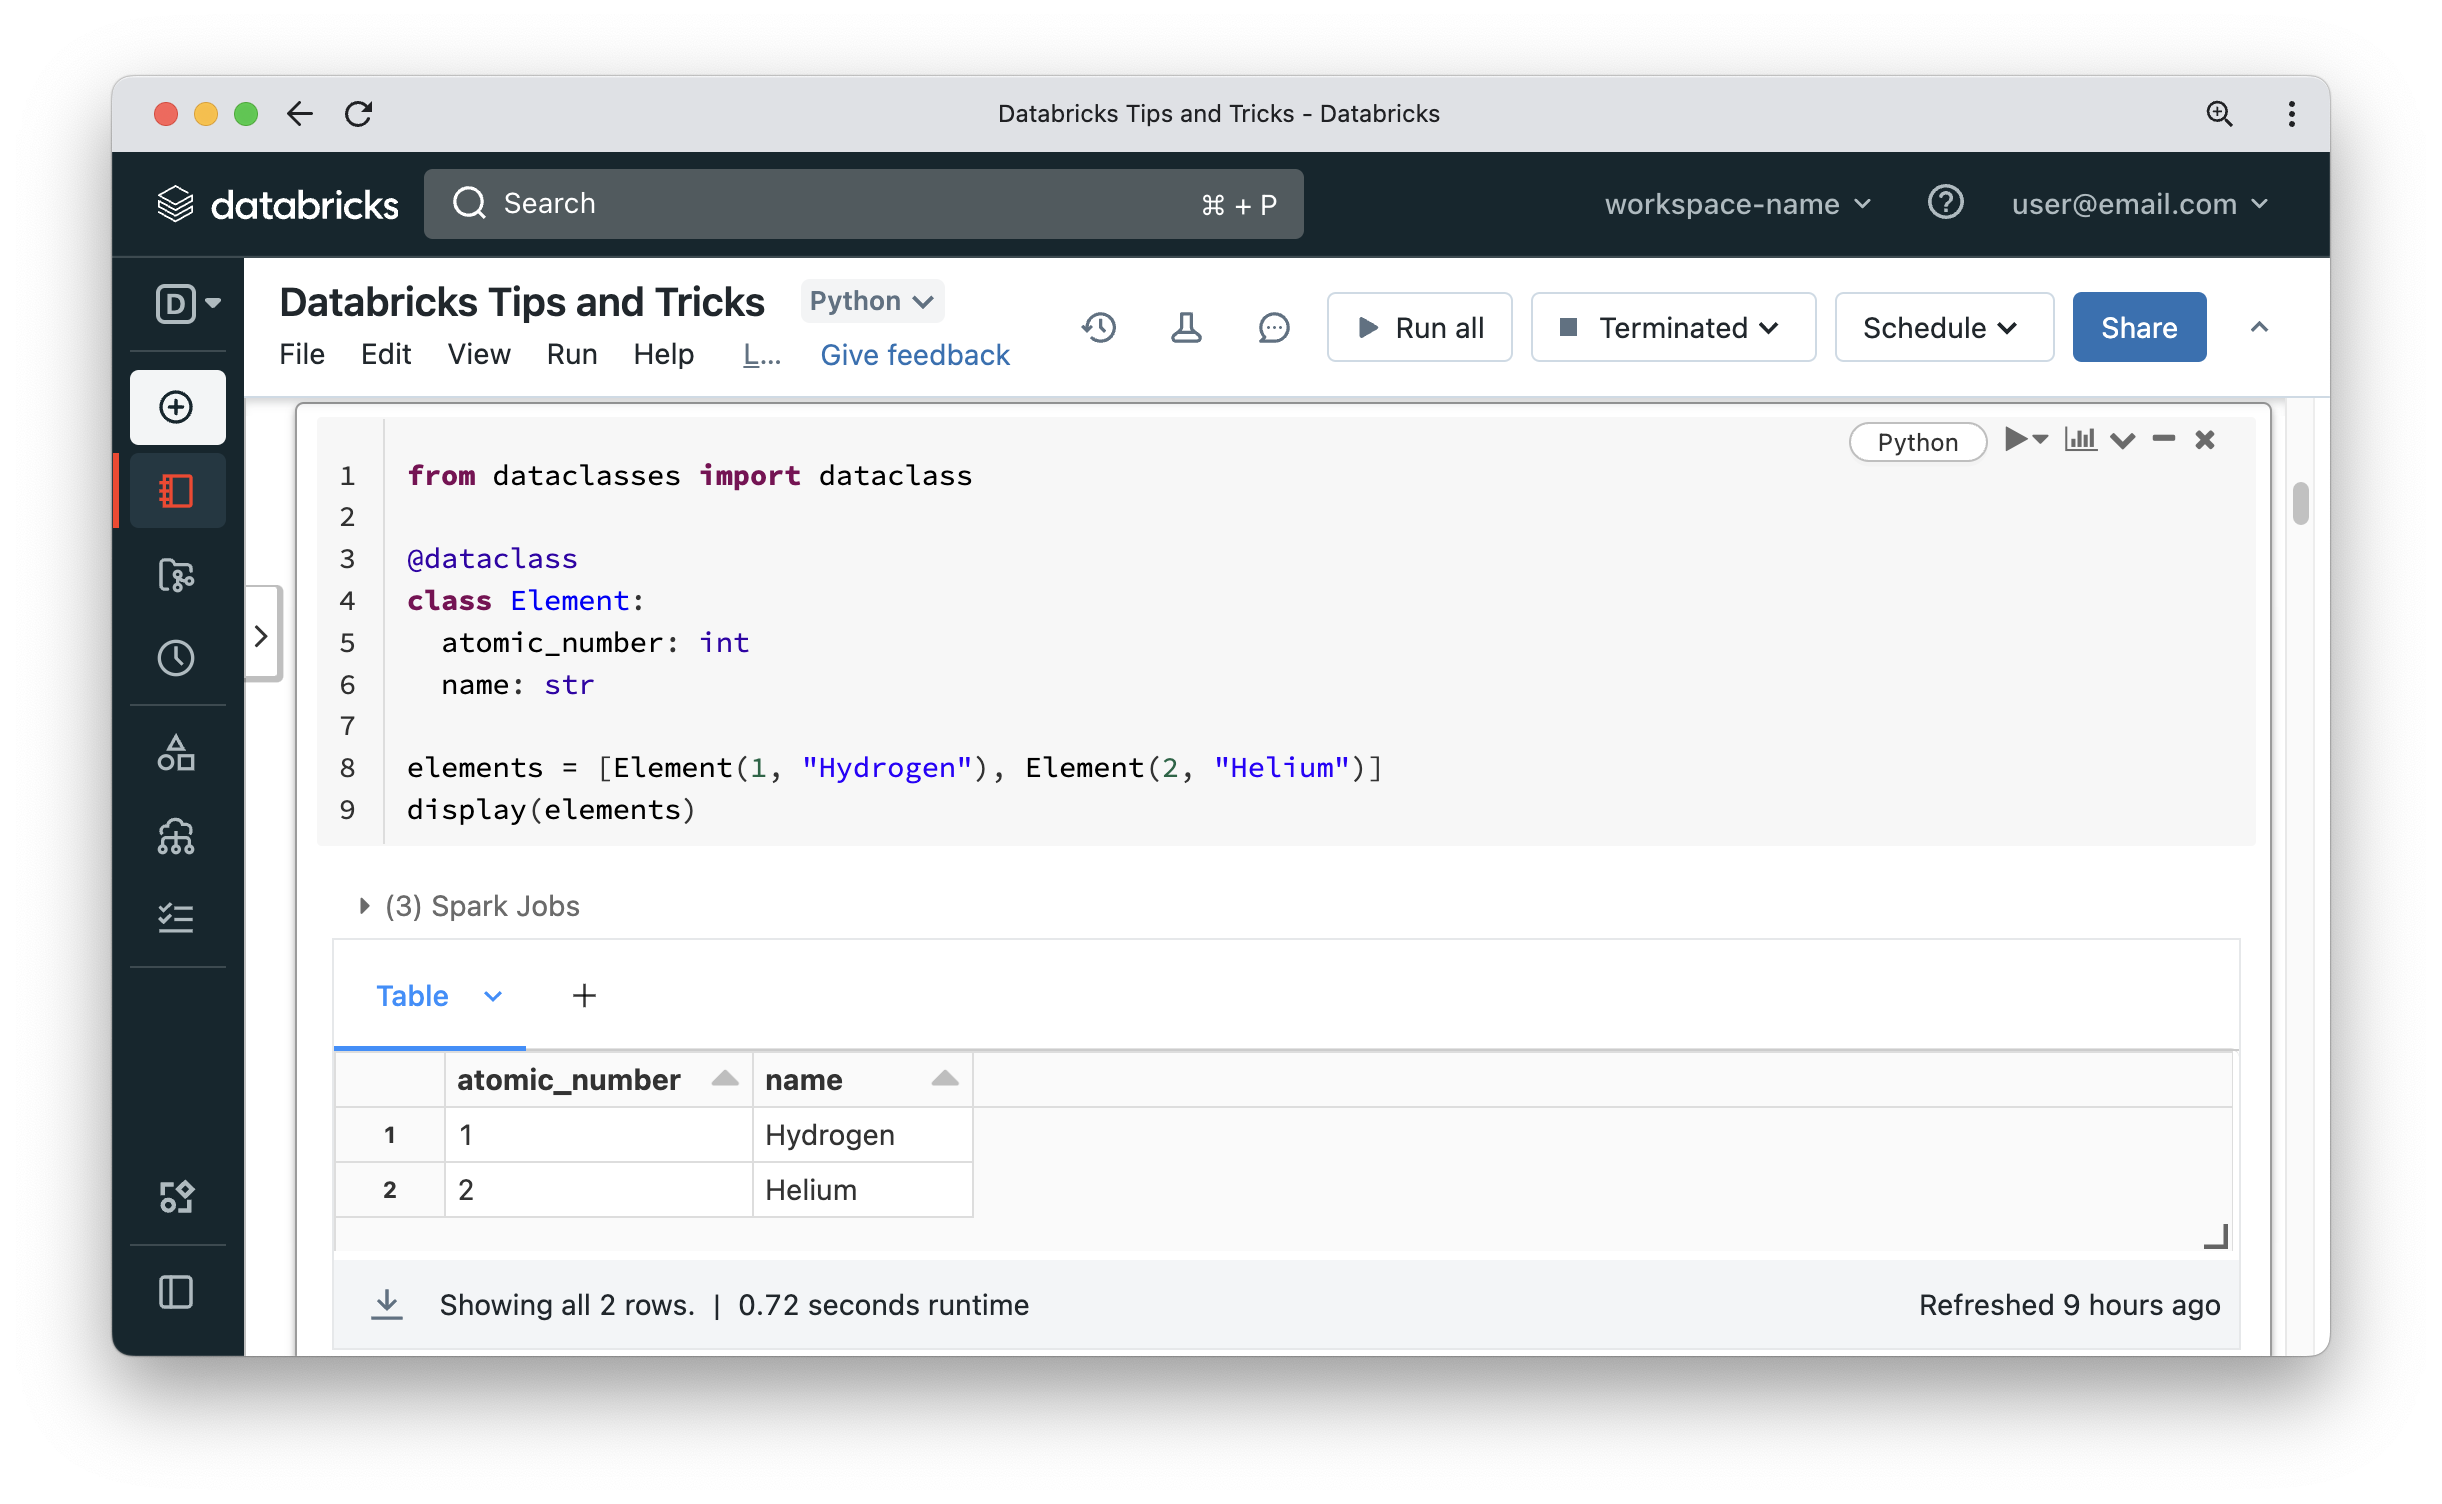
That’s pretty neat and is fairly common to use to display objects returned from functions like dbutils.fs.ls. The display function will work equally well on your objects. As you can see in the below screenshot, the elements list can be displayed in a nice tabular format. Notice that there was a Spark job involved to display the list.
Widgets and Jupyter tips
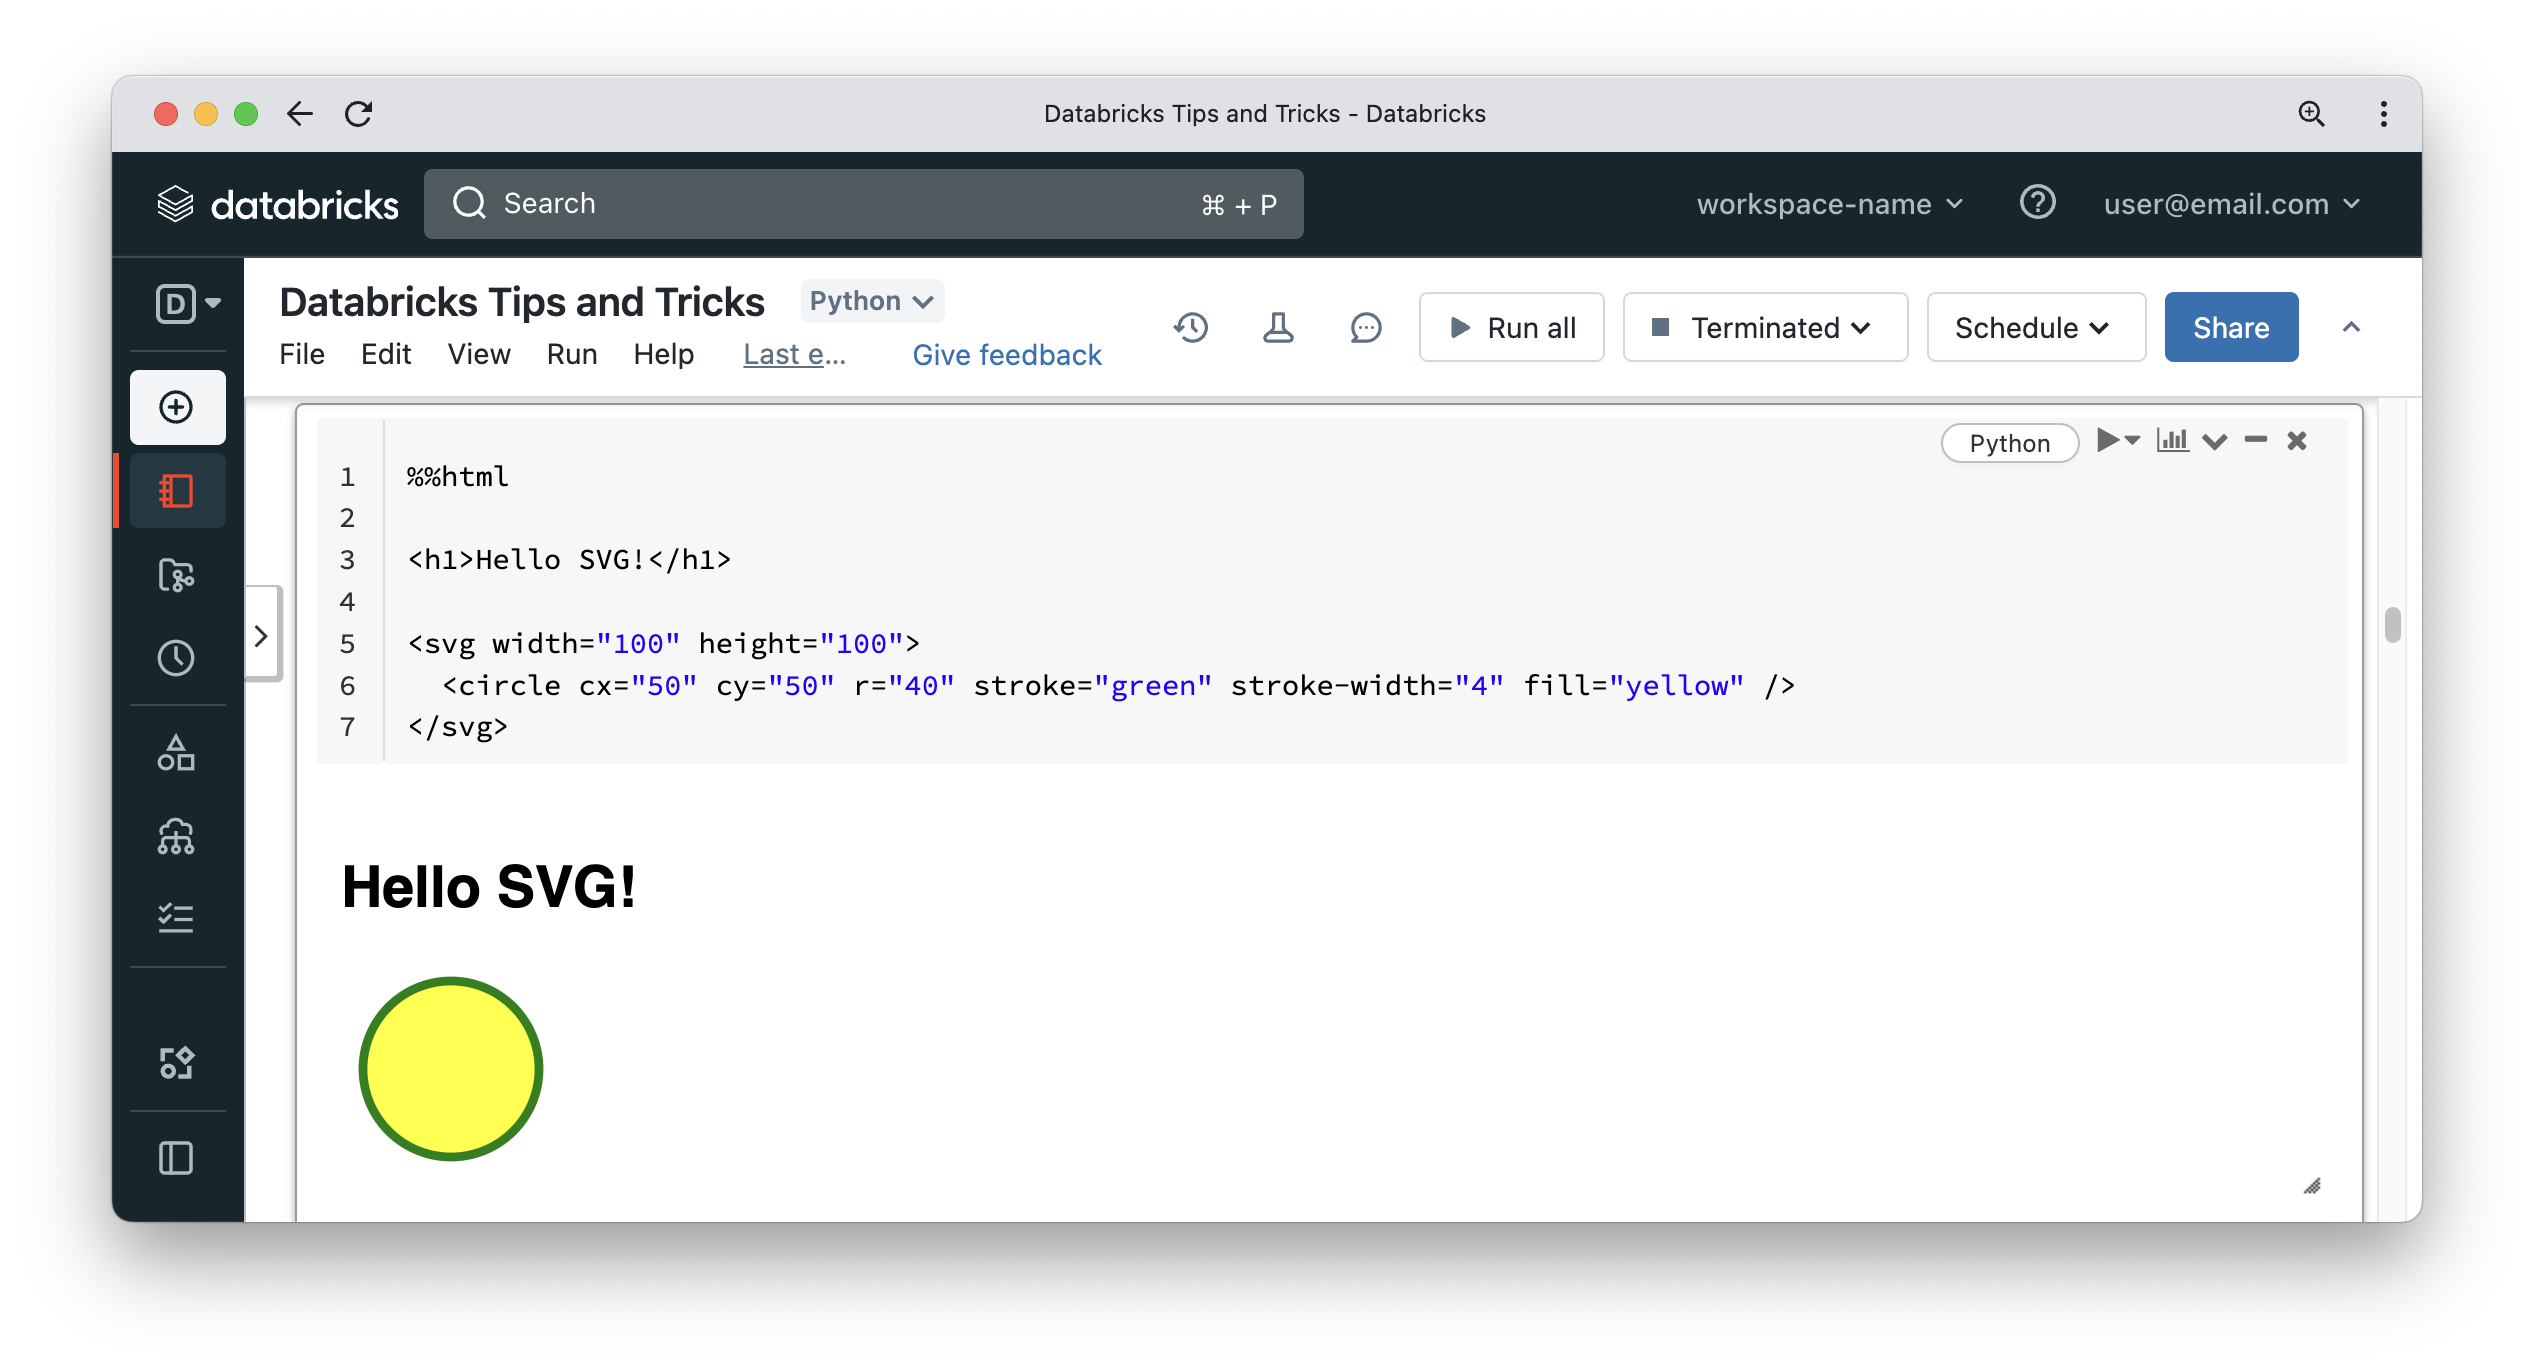
Most developers working on Databricks know that a notebook can accept parameters via widgets, which can display a textbox, a dropdown list or a multi-select list. It is also widely known that a notebook can have multiple languages by using magic commands like %sql, %python, %scala and %r. But not too many people know that a notebook on Databricks has a lot more magic commands and widgets to play around with – the common ones are %fs and %sh. But what about the following?
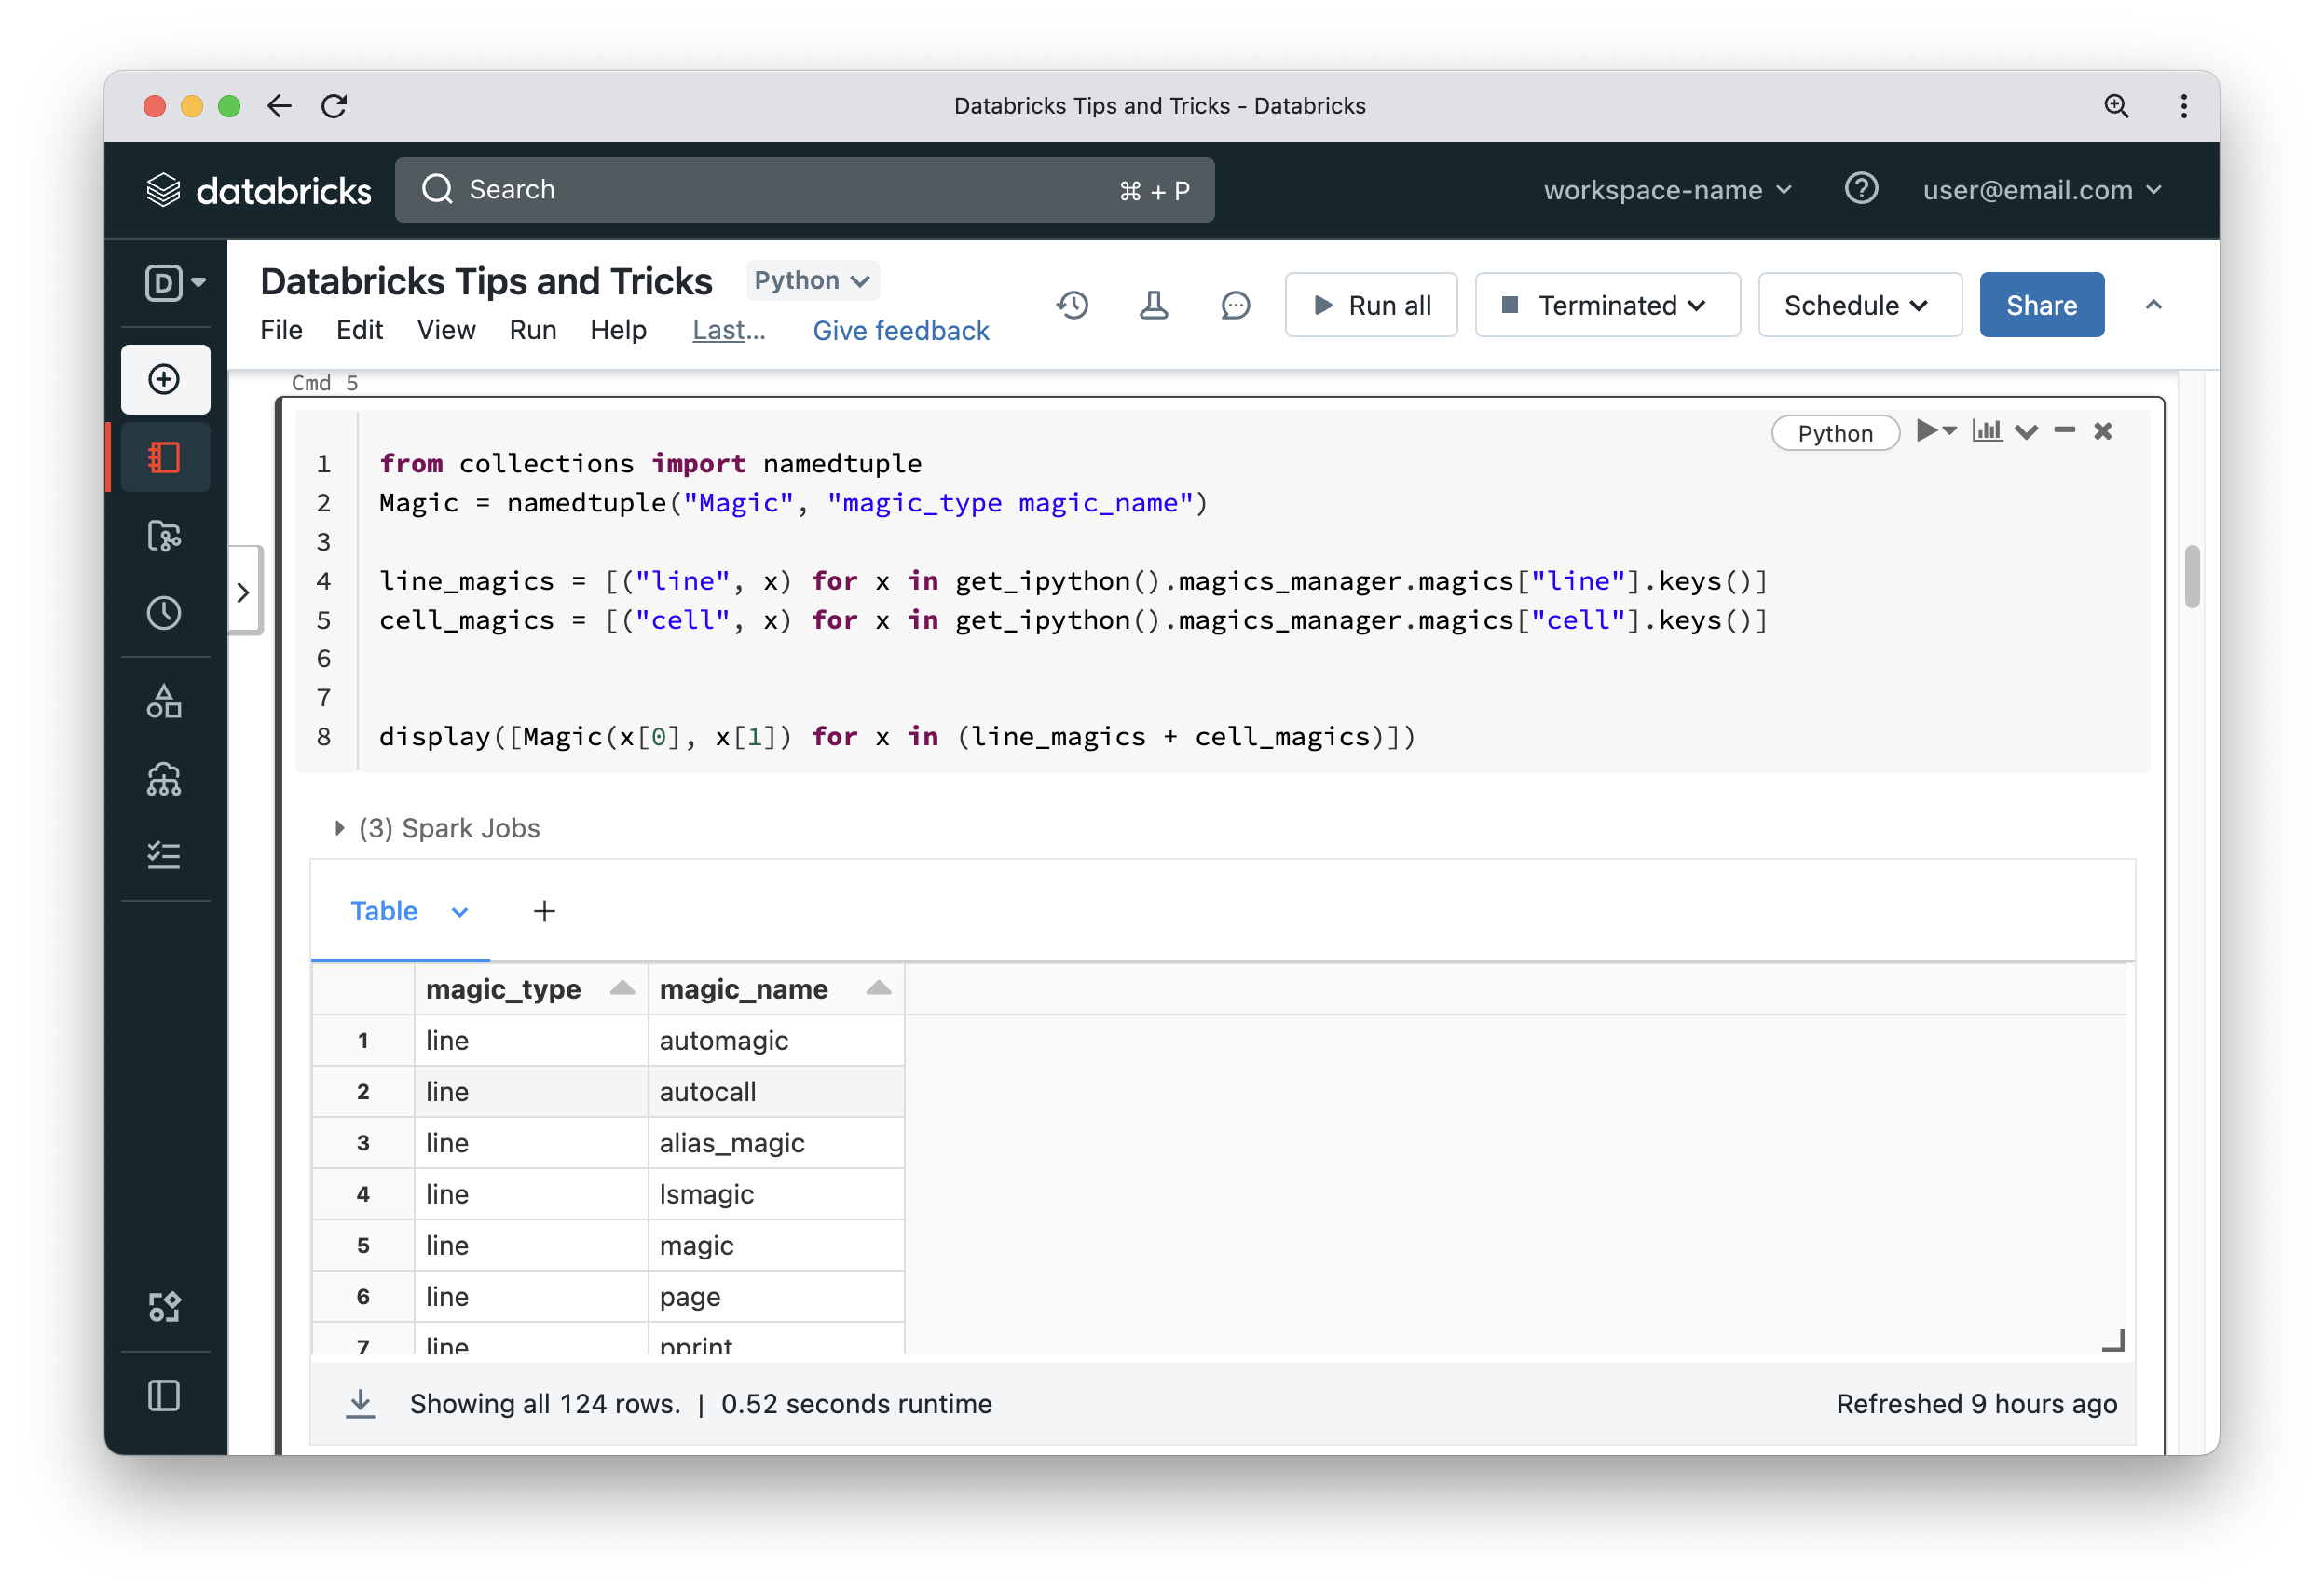
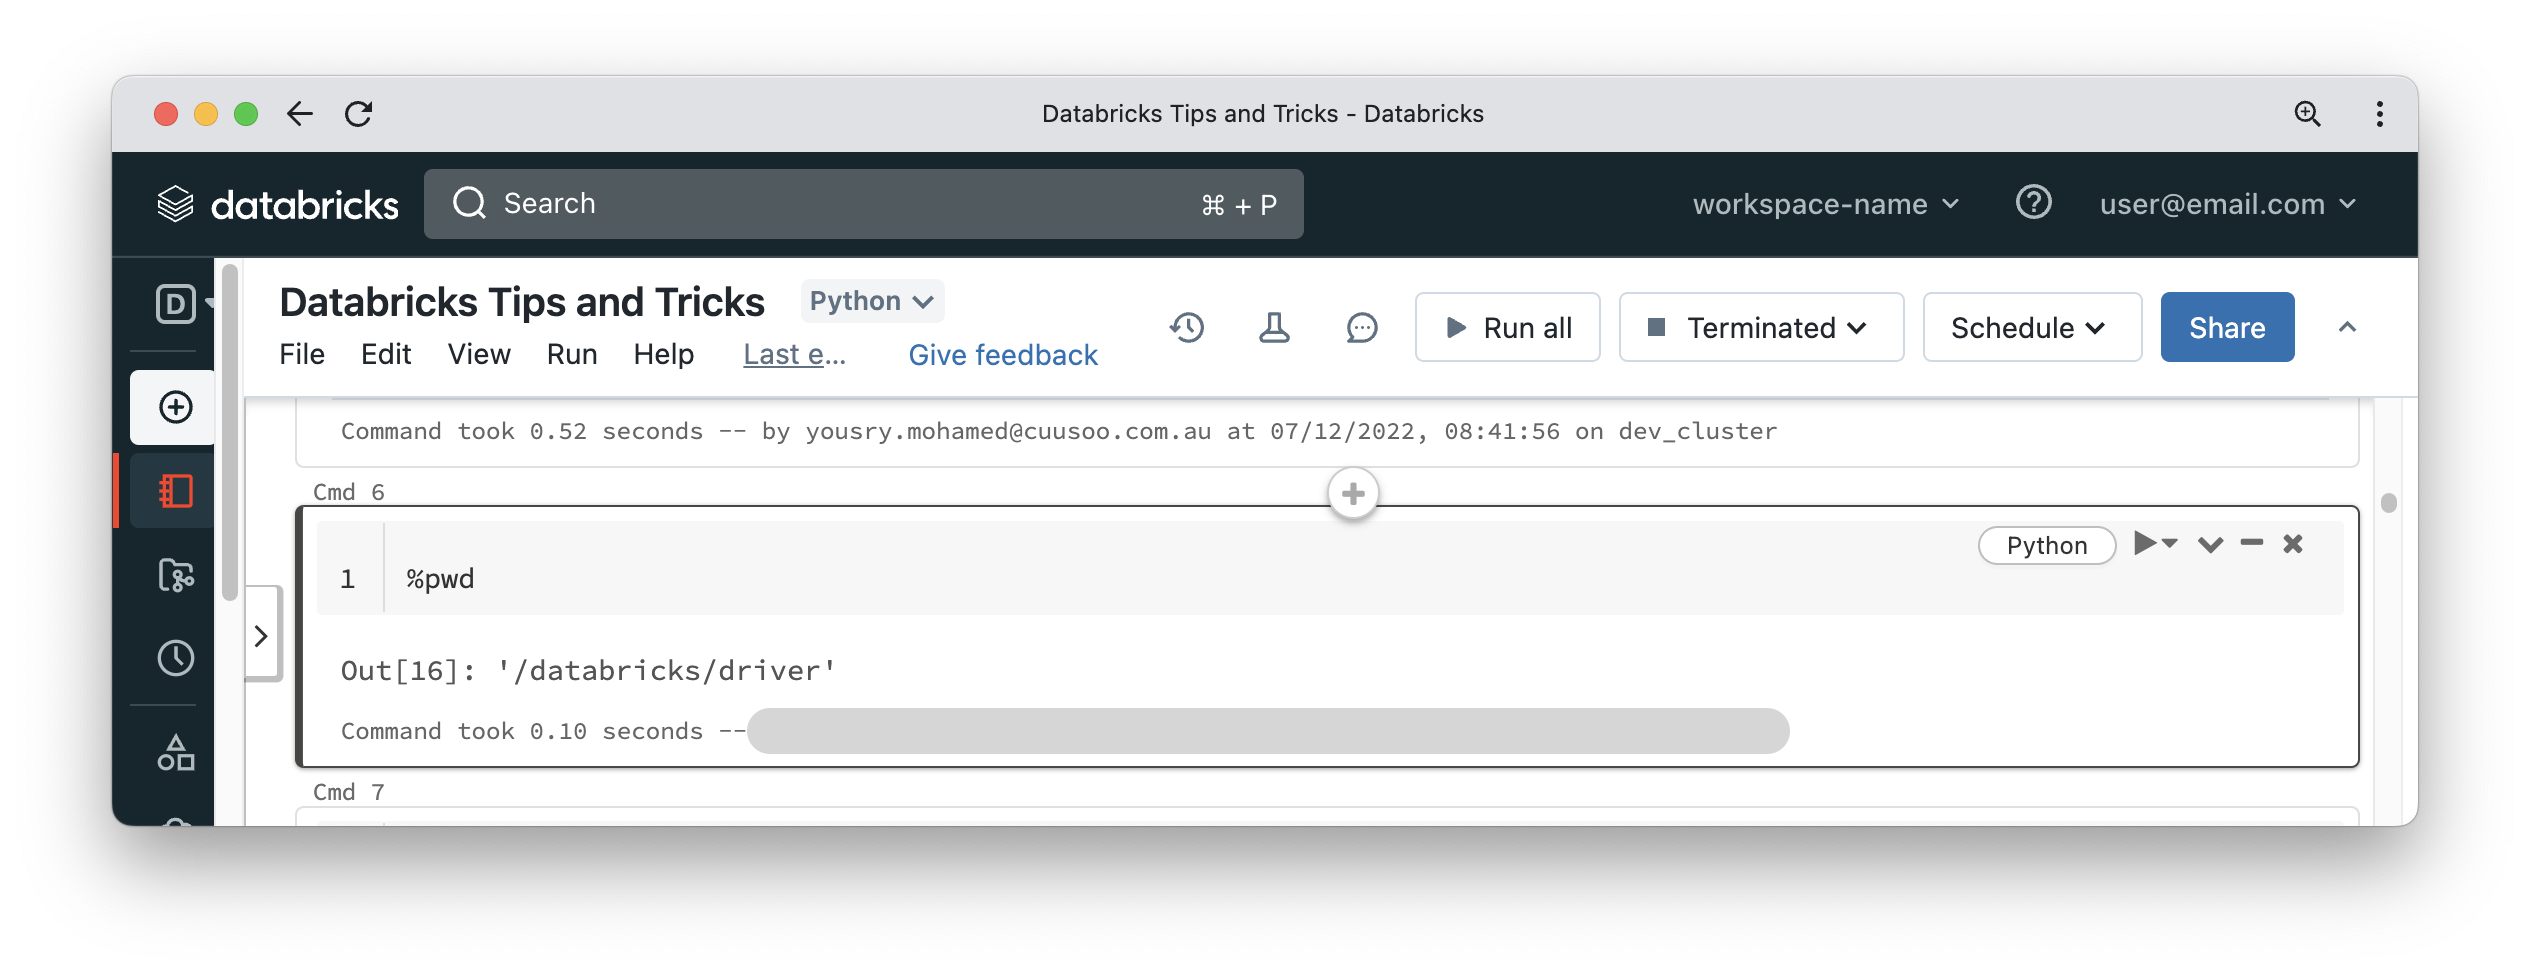
Wow! There are 124 magic commands that we can use. Some of them are pretty basic like printing the current working directory on the driver node or displaying environment variables.
Some of them can even be used to enrich your notebooks! Go take a look and see what interesting use cases you can come up with.
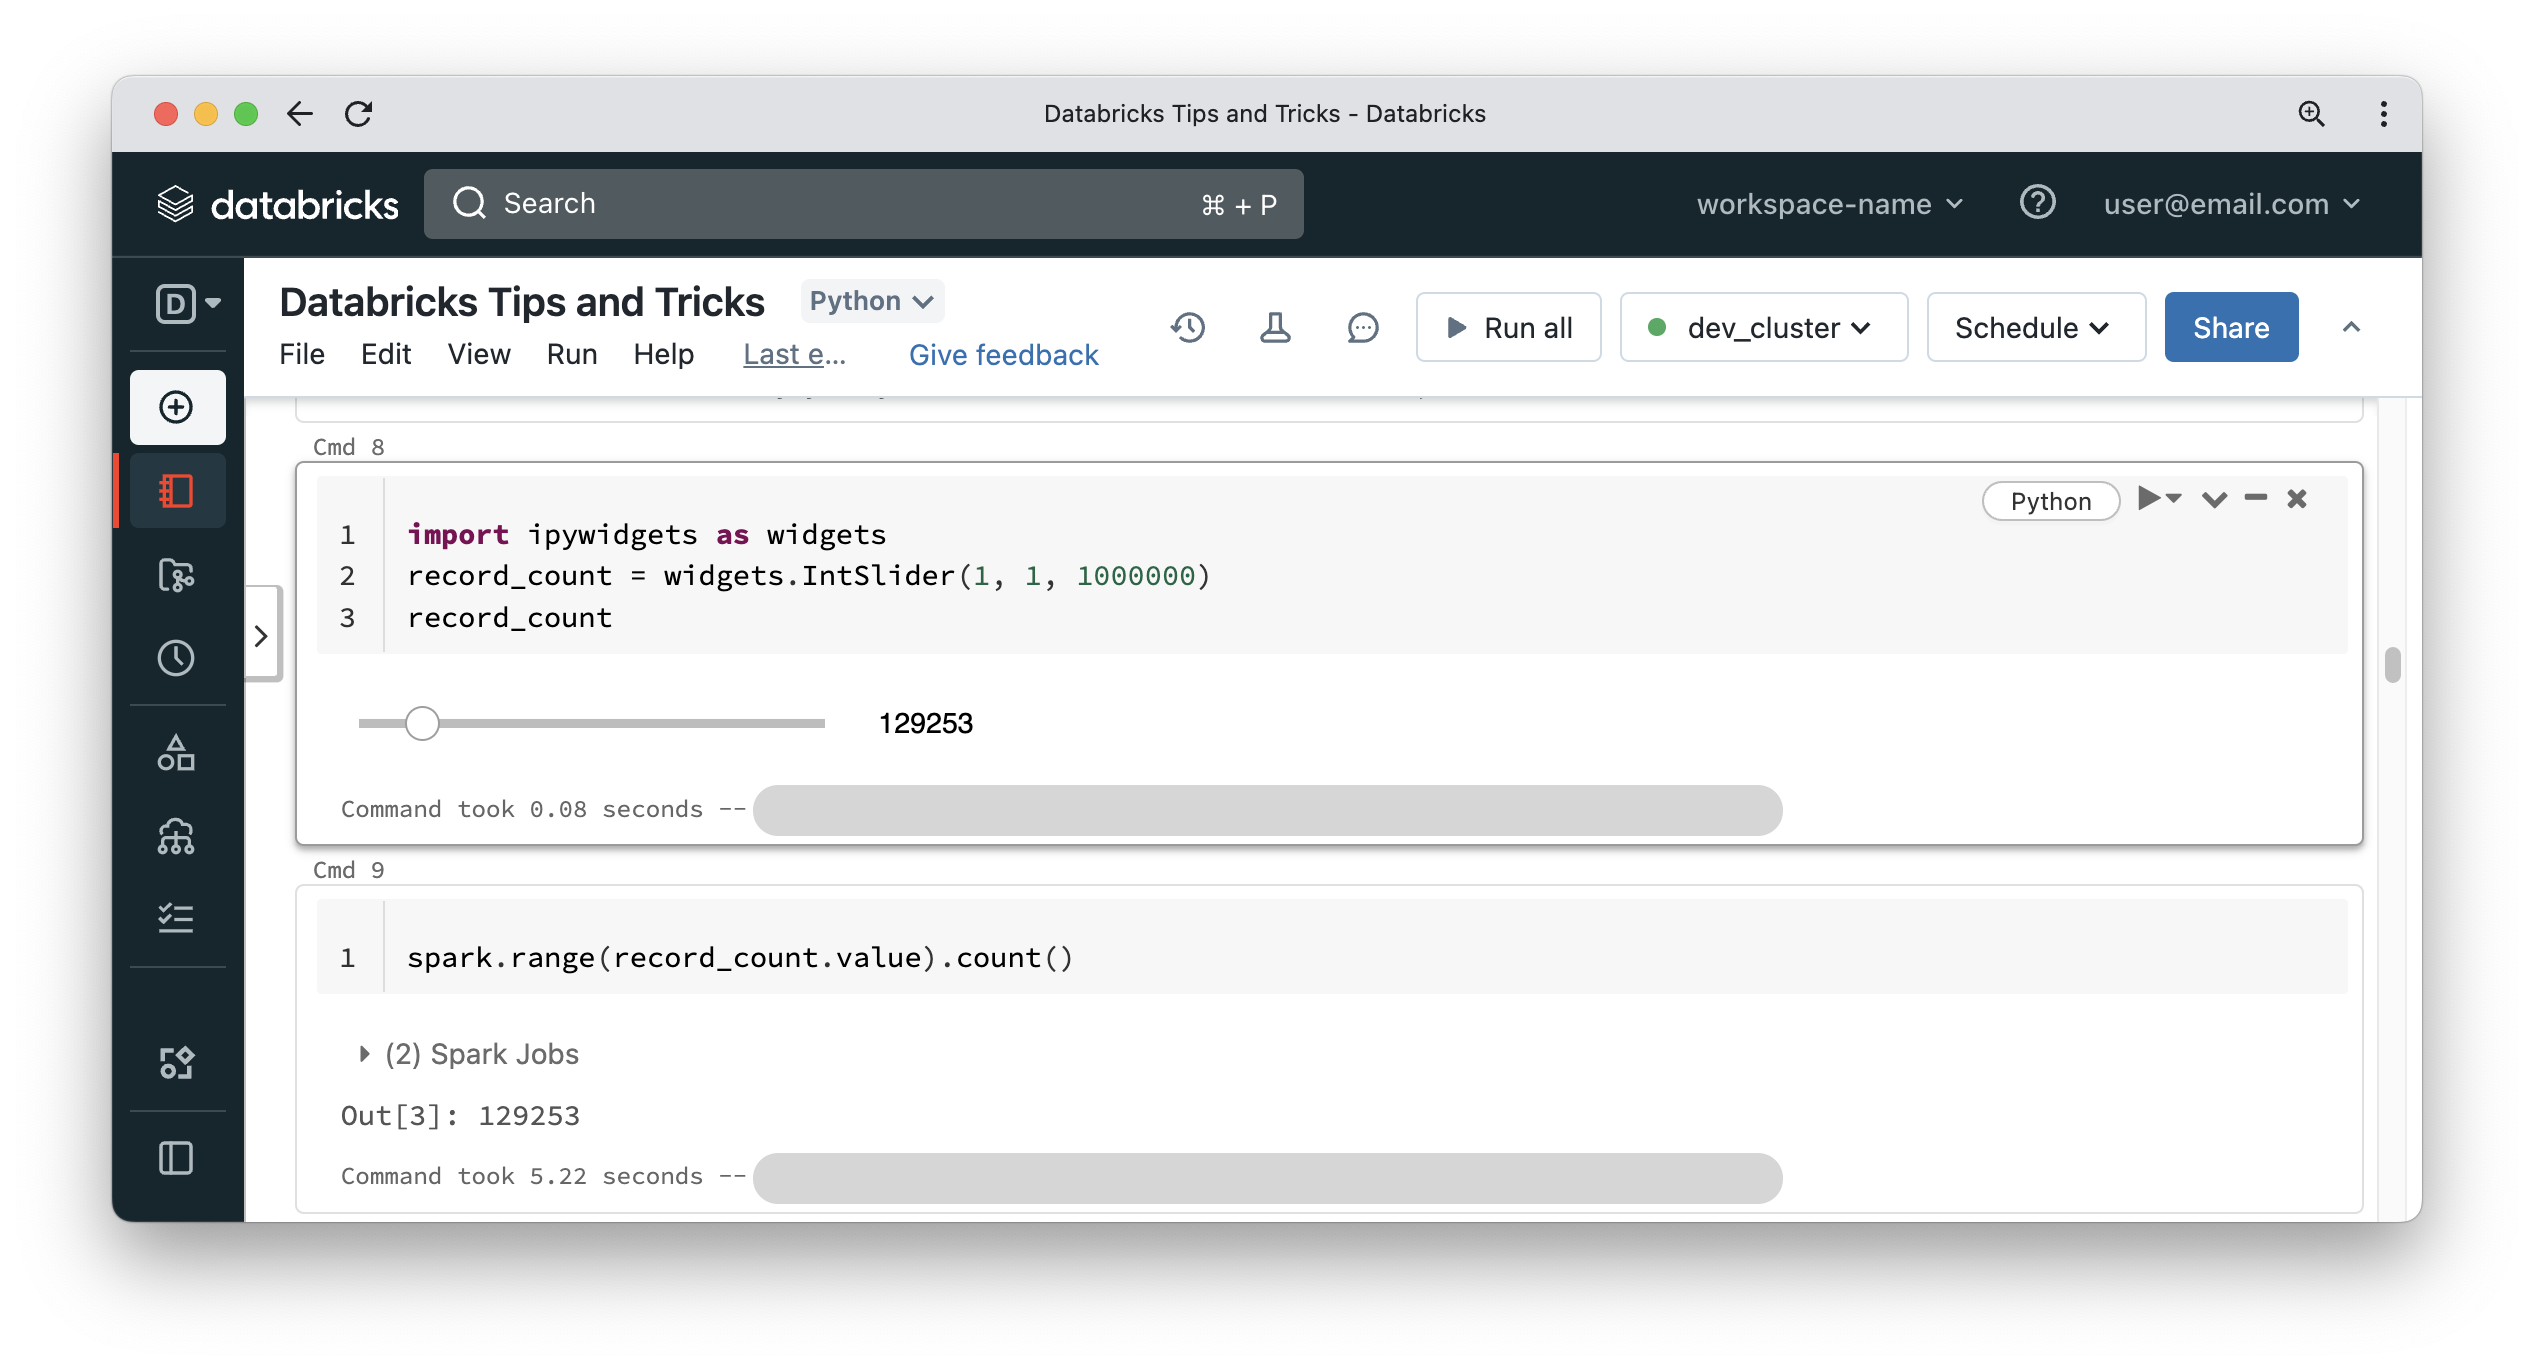
Other widgets can be also used to make your notebook more interactive.
DBFS mounted as local file system (FUSE)
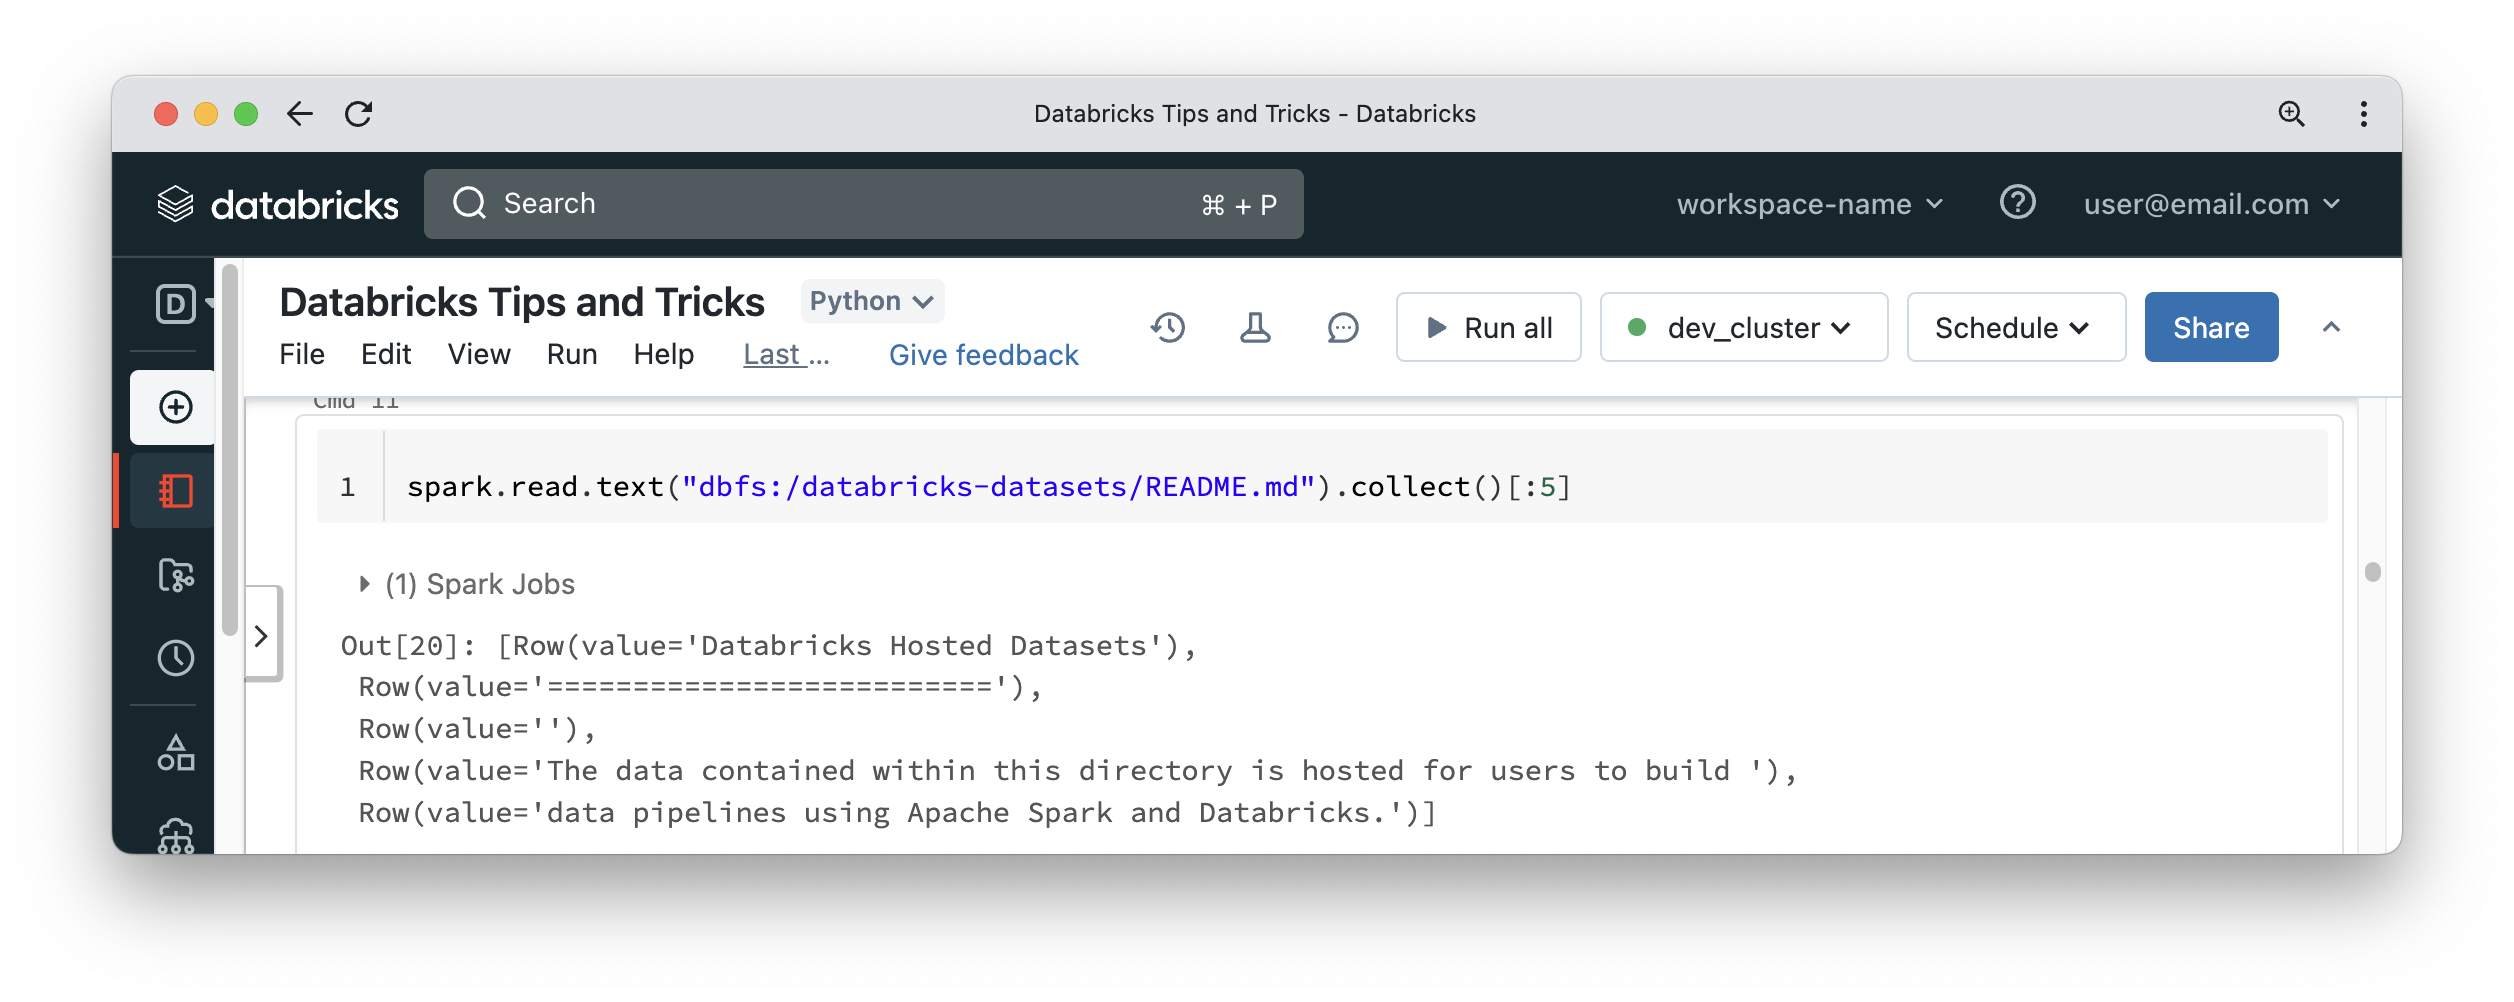
It is usually not recommended to store customer data on the Databricks File System (DBFS), unless through mounting a cloud storage location to DBFS. DBFS is usually accessed from a Spark DataFrame reader with a path prefix of dbfs:/, like the below:
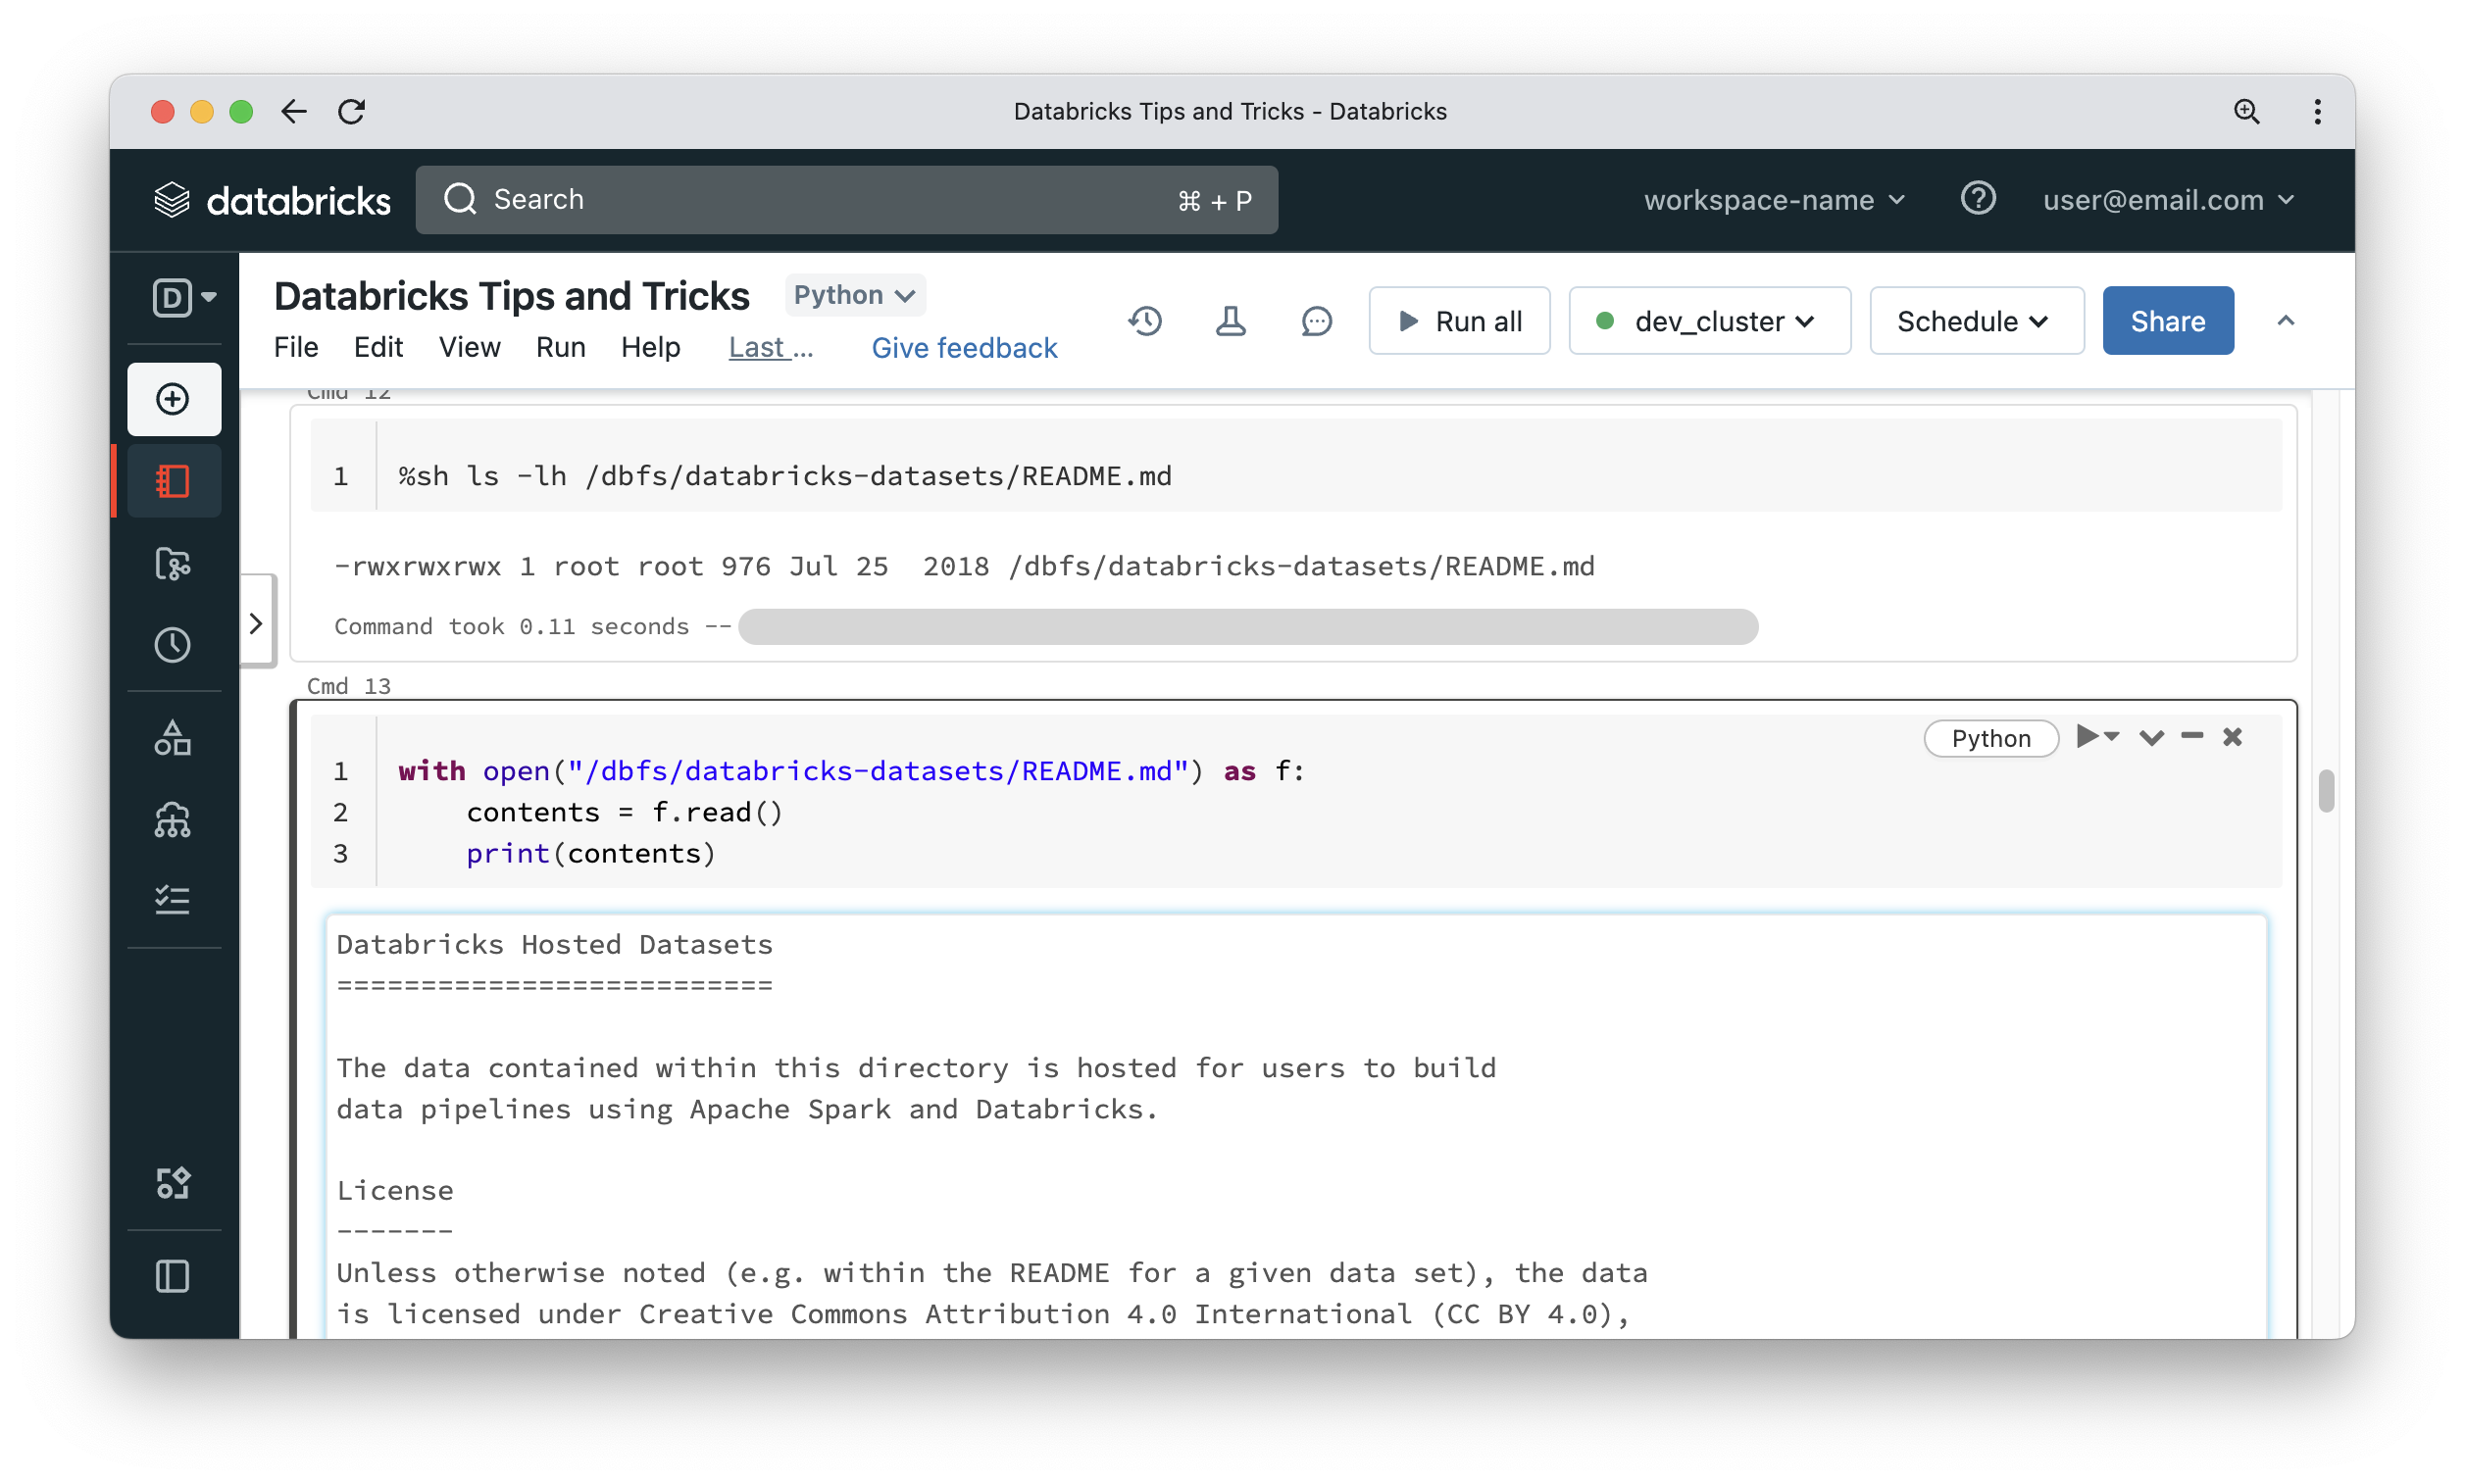
In some other situations it would be useful to access data on DBFS using classic Python APIs. Databricks has a solution for this requirement, and it is called FUSE. For some reason, the name disappeared in the Databricks documentation, but the functionality is still there and is so simple. Just replace dbfs:/ in the path with /dbfs/. That’s all there is to it – you can now treat DBFS as if it were a local file system on the driver node. This allows us to read things like configuration files hosted on DBFS or use libraries like pandas using the Python file API. The first cell in the below screenshot uses a shell magic command, which means it runs a plain Linux operating system command that is not aware of DBFS. The second cell shows using the Python file API to read the content of the file that is hosted on DBFS as if it were a local file.
Importing modules in Python notebooks by manipulating sys.path
A notebook is bound to a Python kernel. Some developers use the following method to import a module from a repo, located in the Repos folder. It is not the most robust way to import modules but it is another option in your toolbox.
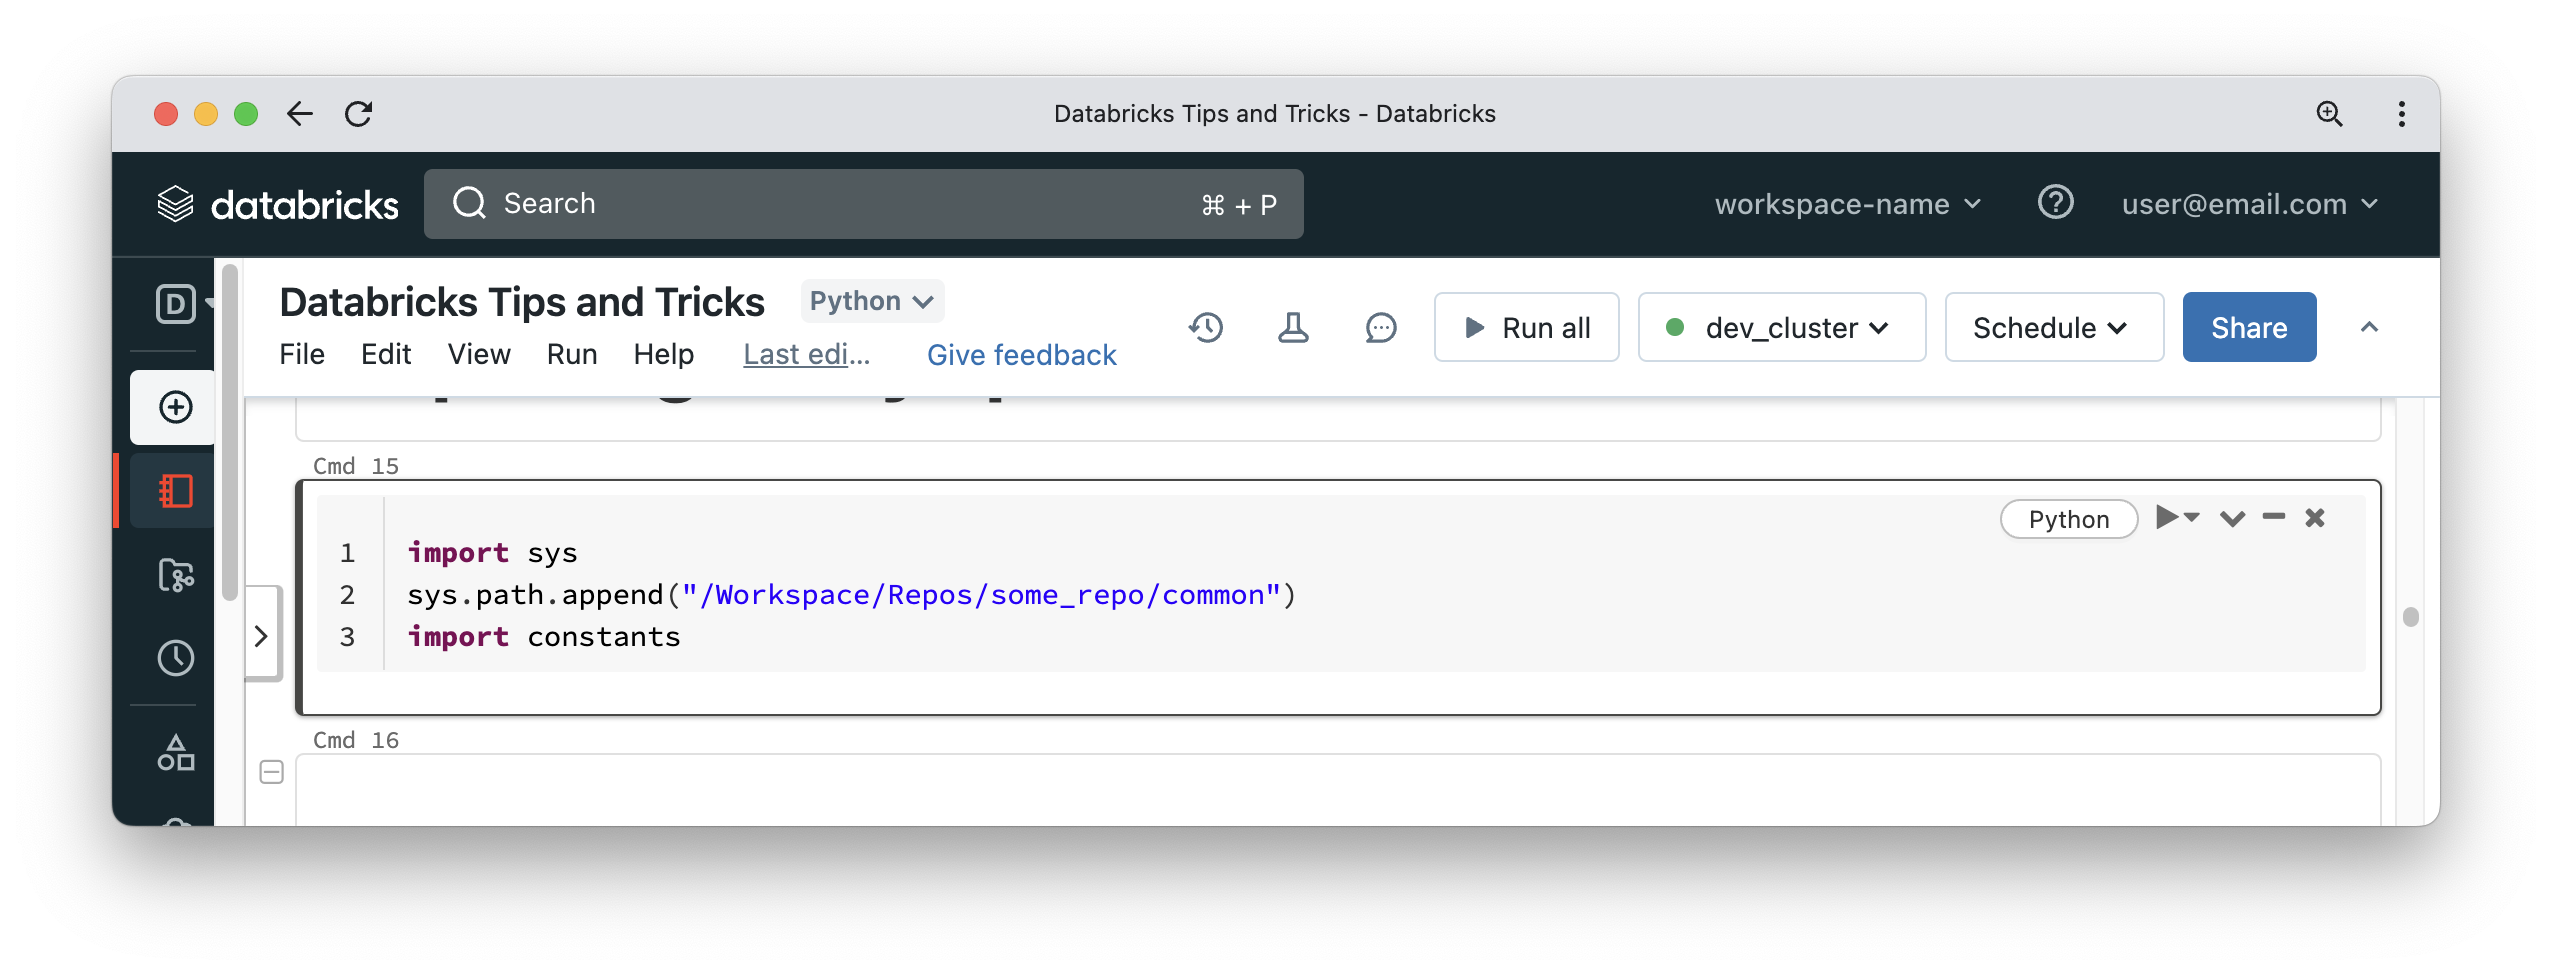
You can now use logic defined in the constants module. Let’s assume you or someone else updates the code contained in the constants module. If you try to re-run the above cell, you will not get any changes reflecting in the current notebook, because the kernel will be still pointing to the prior version of your code. The solution to this issue is to detach the notebook from your compute cluster, re-attach the notebook to the cluster and execute your code. This way you will get a fresh kernel and importing the module will give you access to the latest version of your code.
Using the REST API & Databricks SDK from your notebooks
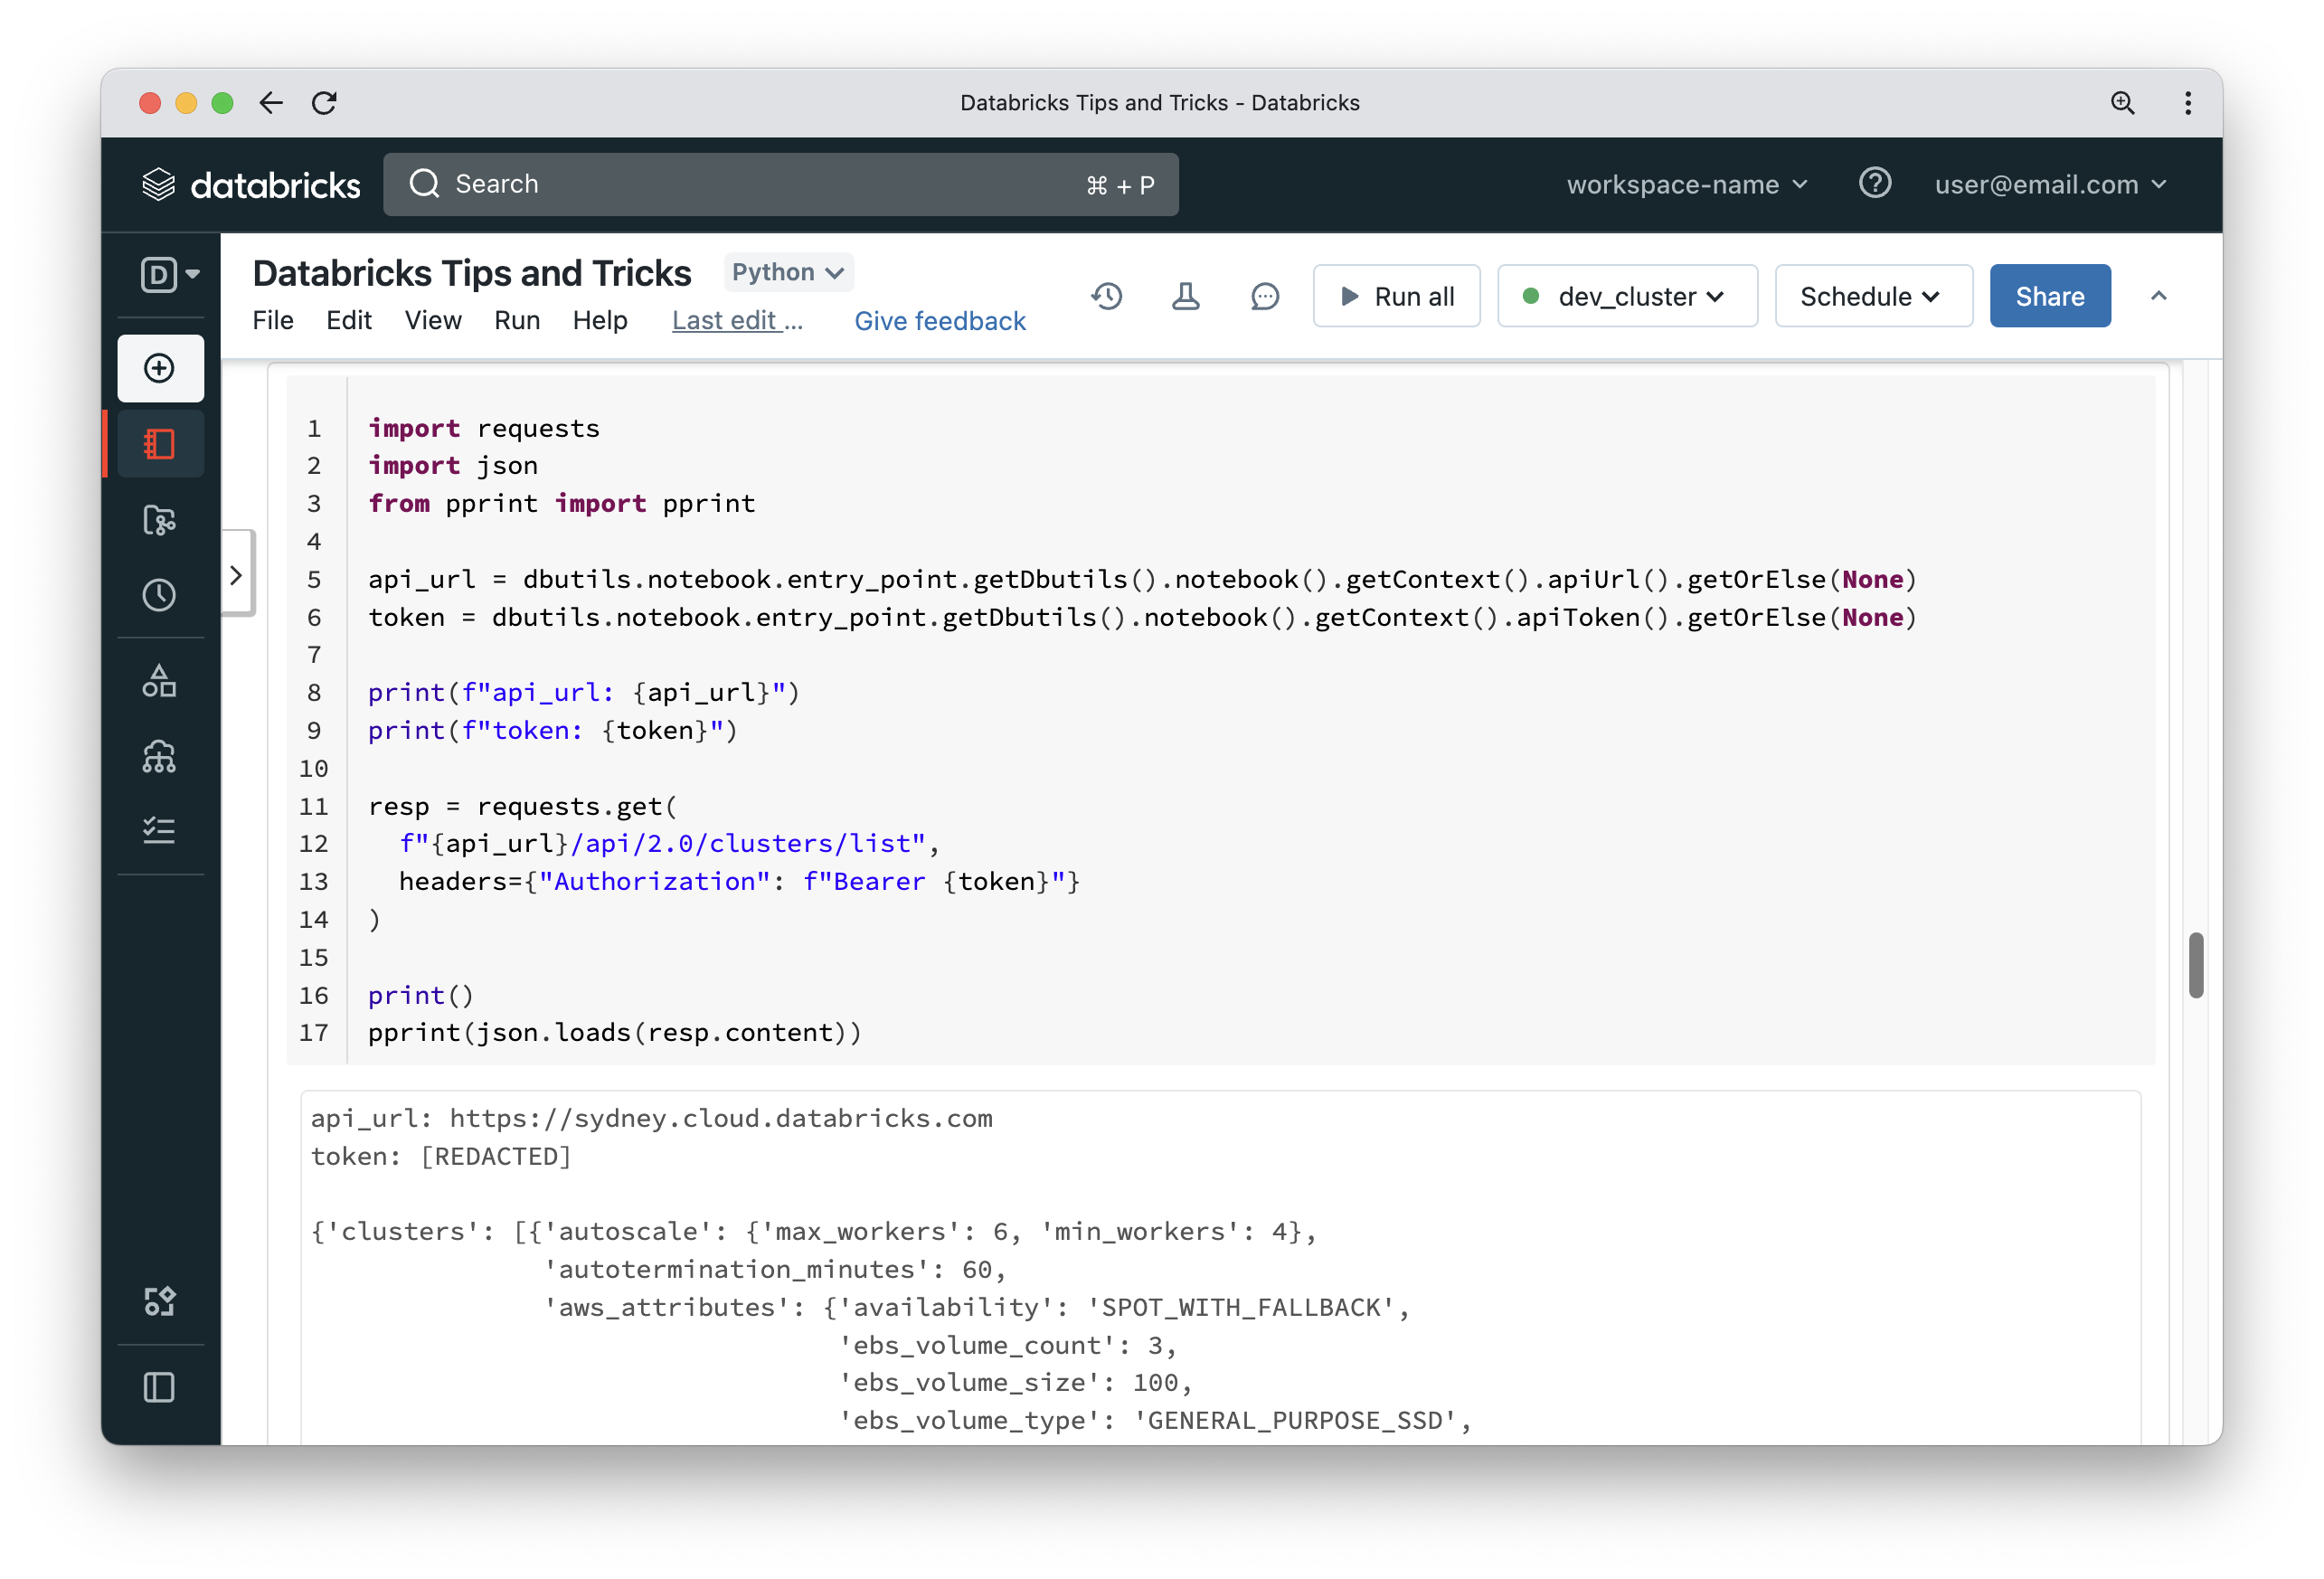
DBUtils is a powerful module available inside notebooks that gives you access to many useful APIs, such as dealing with the file system, task values and notebooks. It has some hidden features to allow you to retrieve a PAT token that is used to authenticate with Databricks backend APIs. This token can be used to call REST APIs from the notebook.
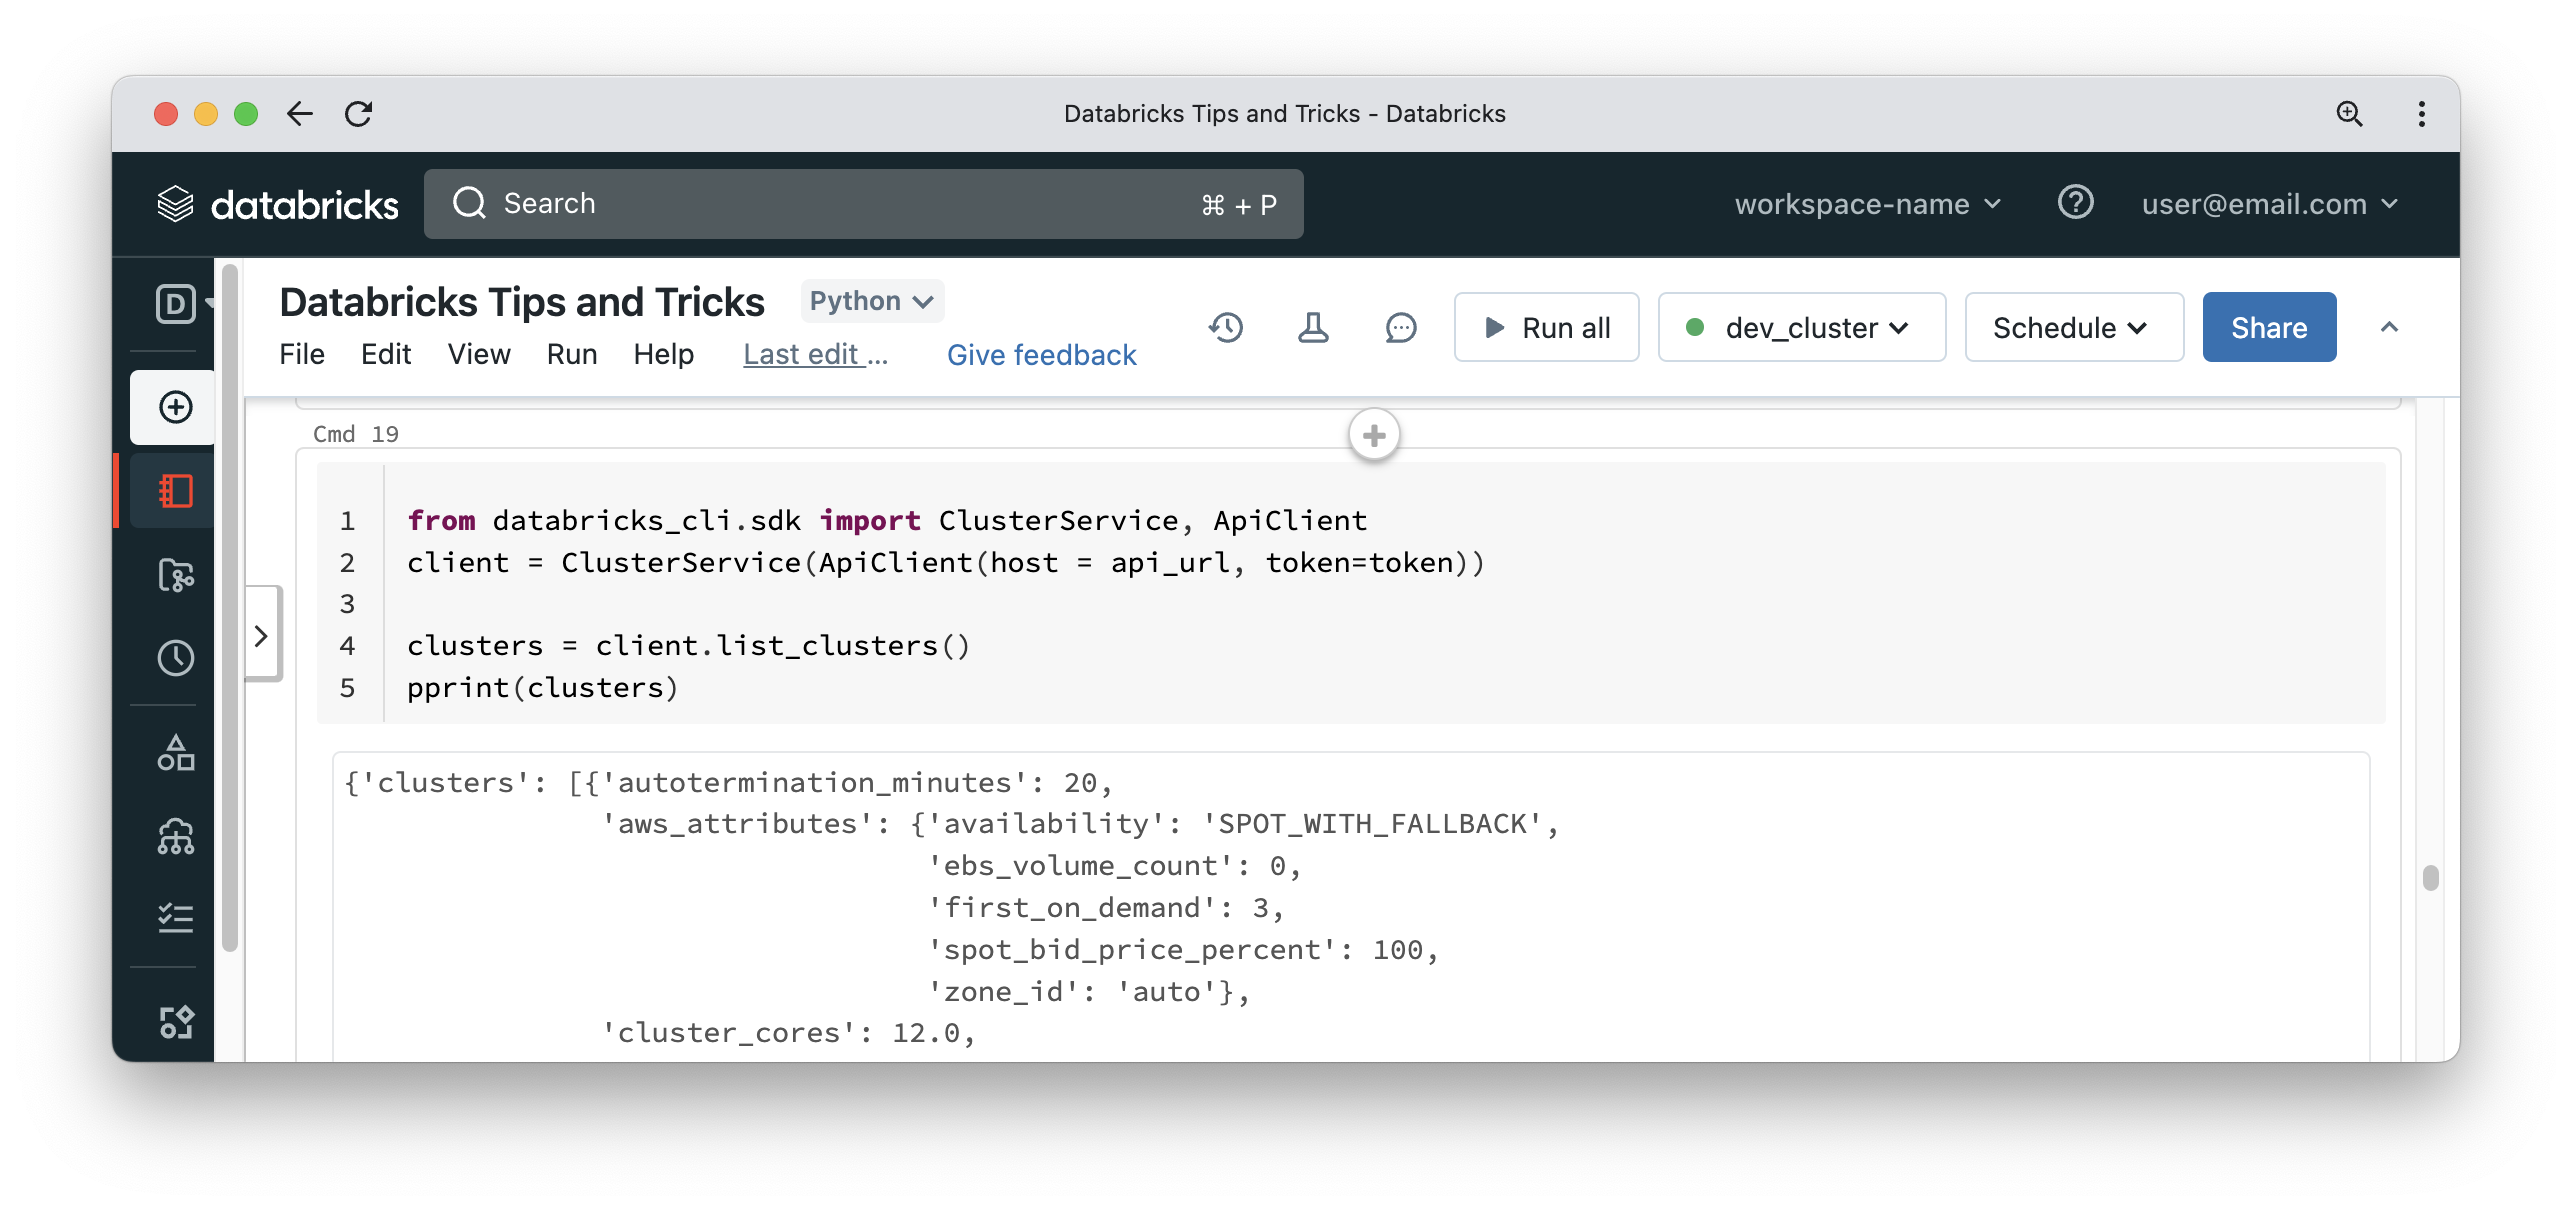
If you feel the REST API is too verbose, you can also use the SDK which comes as part of the Databricks CLI. You can install the Databricks CLI inside a notebook by running “%pip install databricks-cli“.
Once the CLI is installed, you can use the SDK APIs which are more concise and easier to use than the REST API endpoints.
P.S. Installing new packages inside the notebook will require the interpreter to be restarted. This means the cell to get PAT token has to be re-run.
Performance tuning
Disk Cache
Disk Cache is a Databricks feature that keeps a copy of parquet files loaded from cloud storage on the local disks of worker nodes for faster access if the same files are read more than once. The old name for this feature was delta cache but it has now been renamed to disk cache and is quite different from Spark caching. For Spark caching, you have to cache the DataFrame (which means it is not limited to parquet files) explicitly and will usually use memory (although there are many other options). On the other hand, disk caching happens on disk, and you don’t have to opt in per DataFrame. To make use of this feature, use a suitable worker node type and be sure to set the Spark configuration property spark.databricks.io.cache.enabled to true.
Let’s see an example of disk cache. In this example, we will run a DataFrame transformation that scans all columns of a parquet folder to force disk cache to load all the contents of parquet files. Parquet files are columnar and if the query needs a subset of the columns, then Spark reads those columns ONLY.
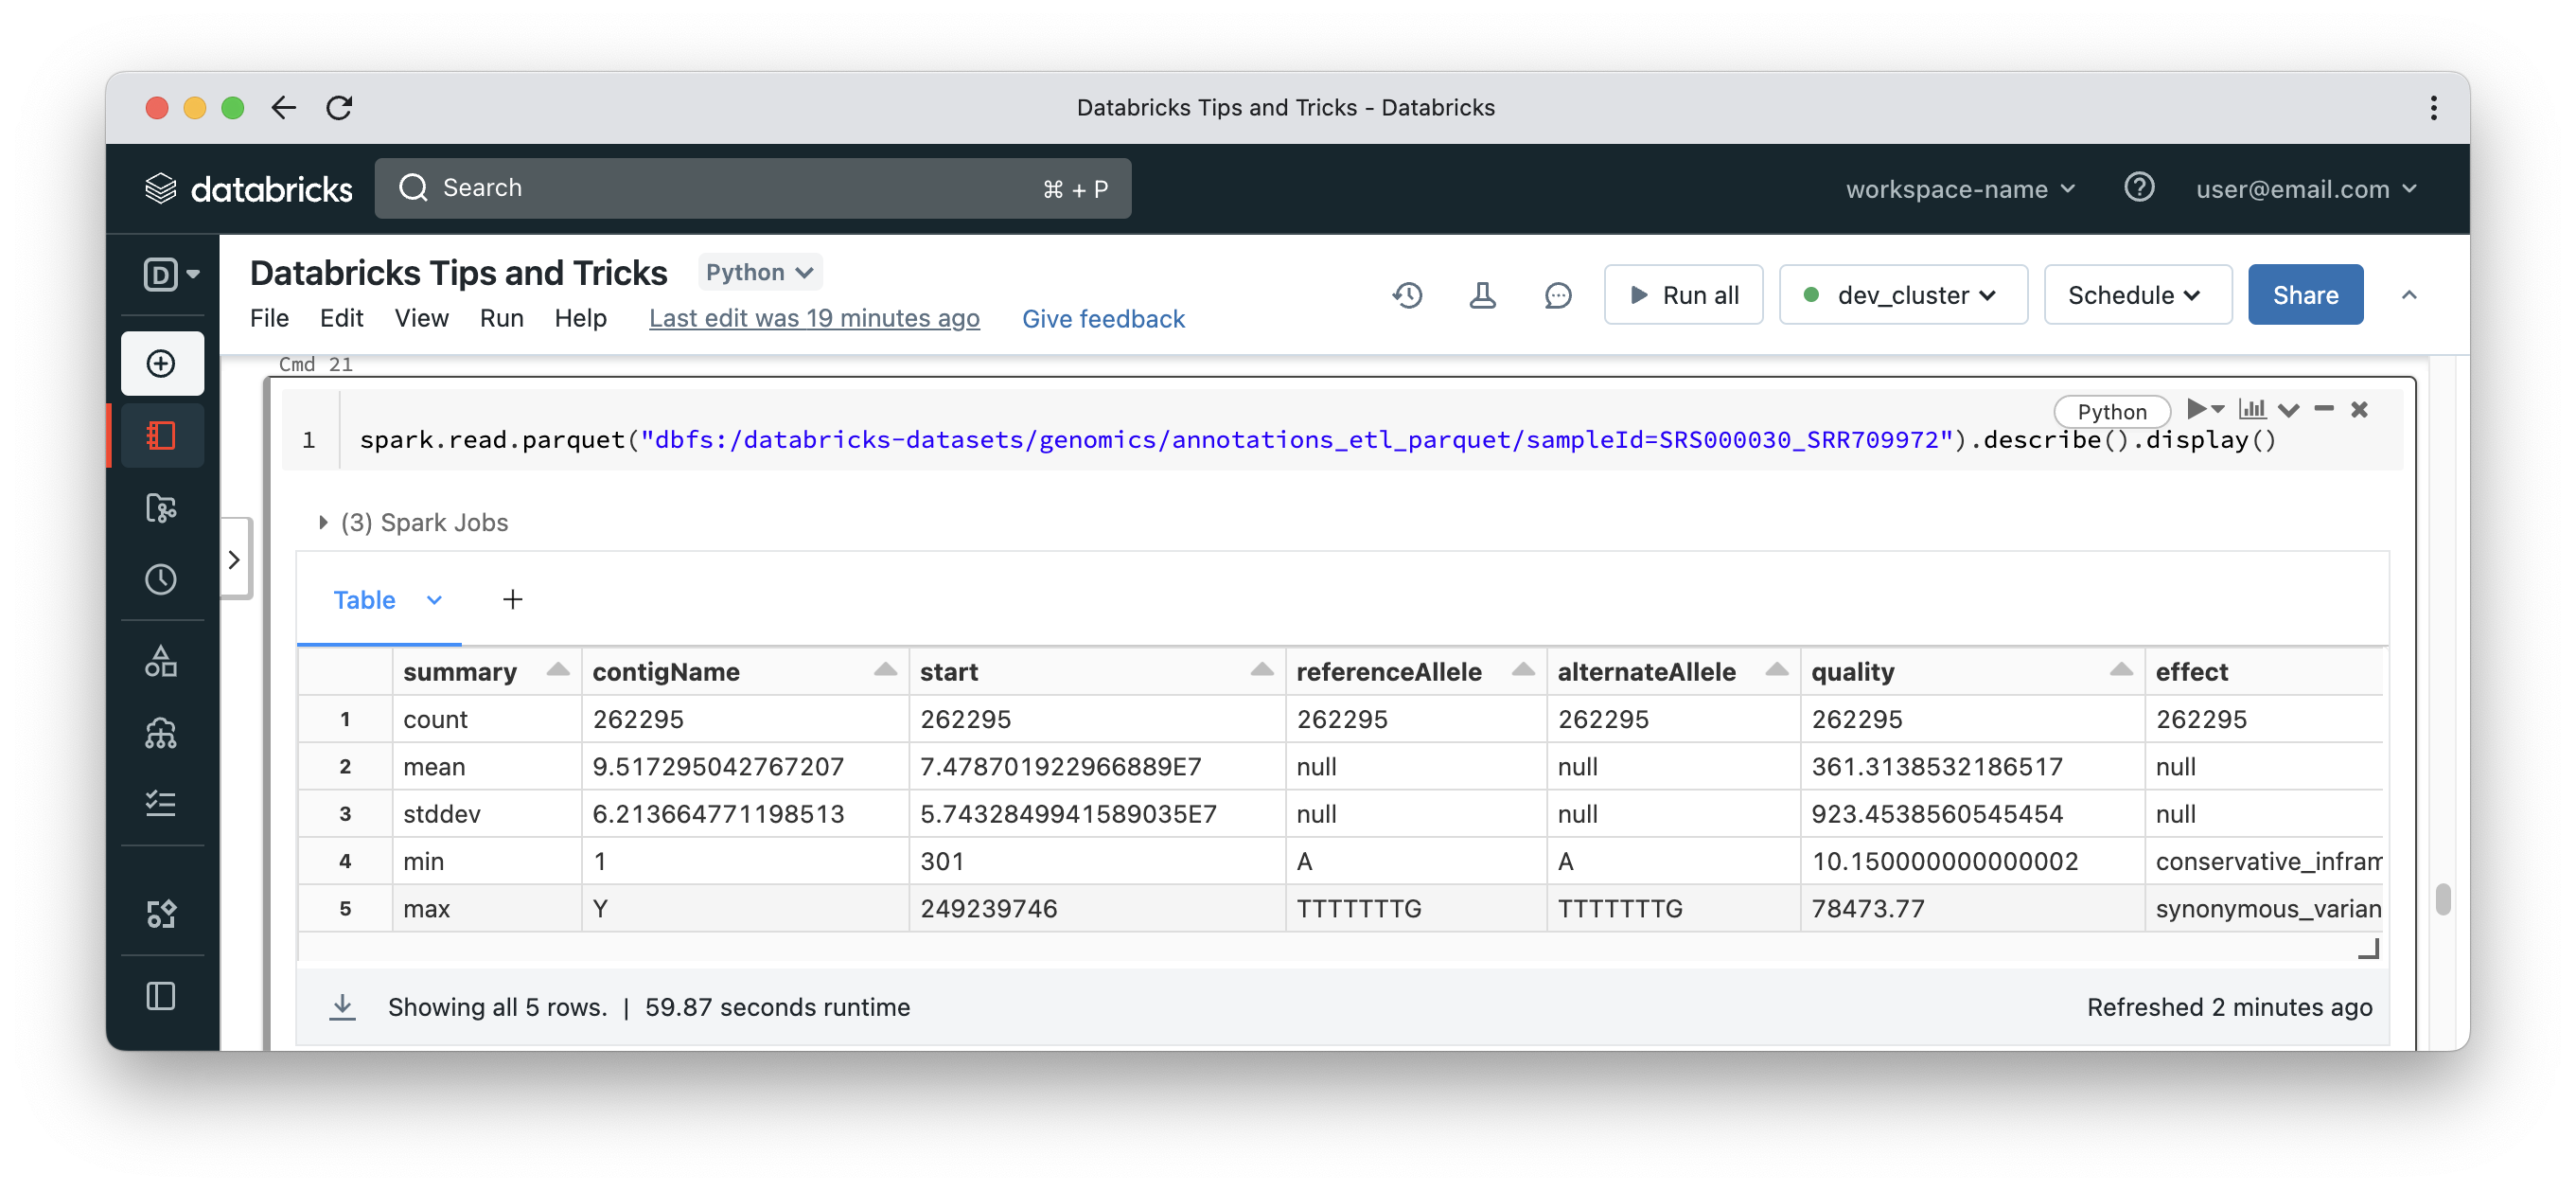
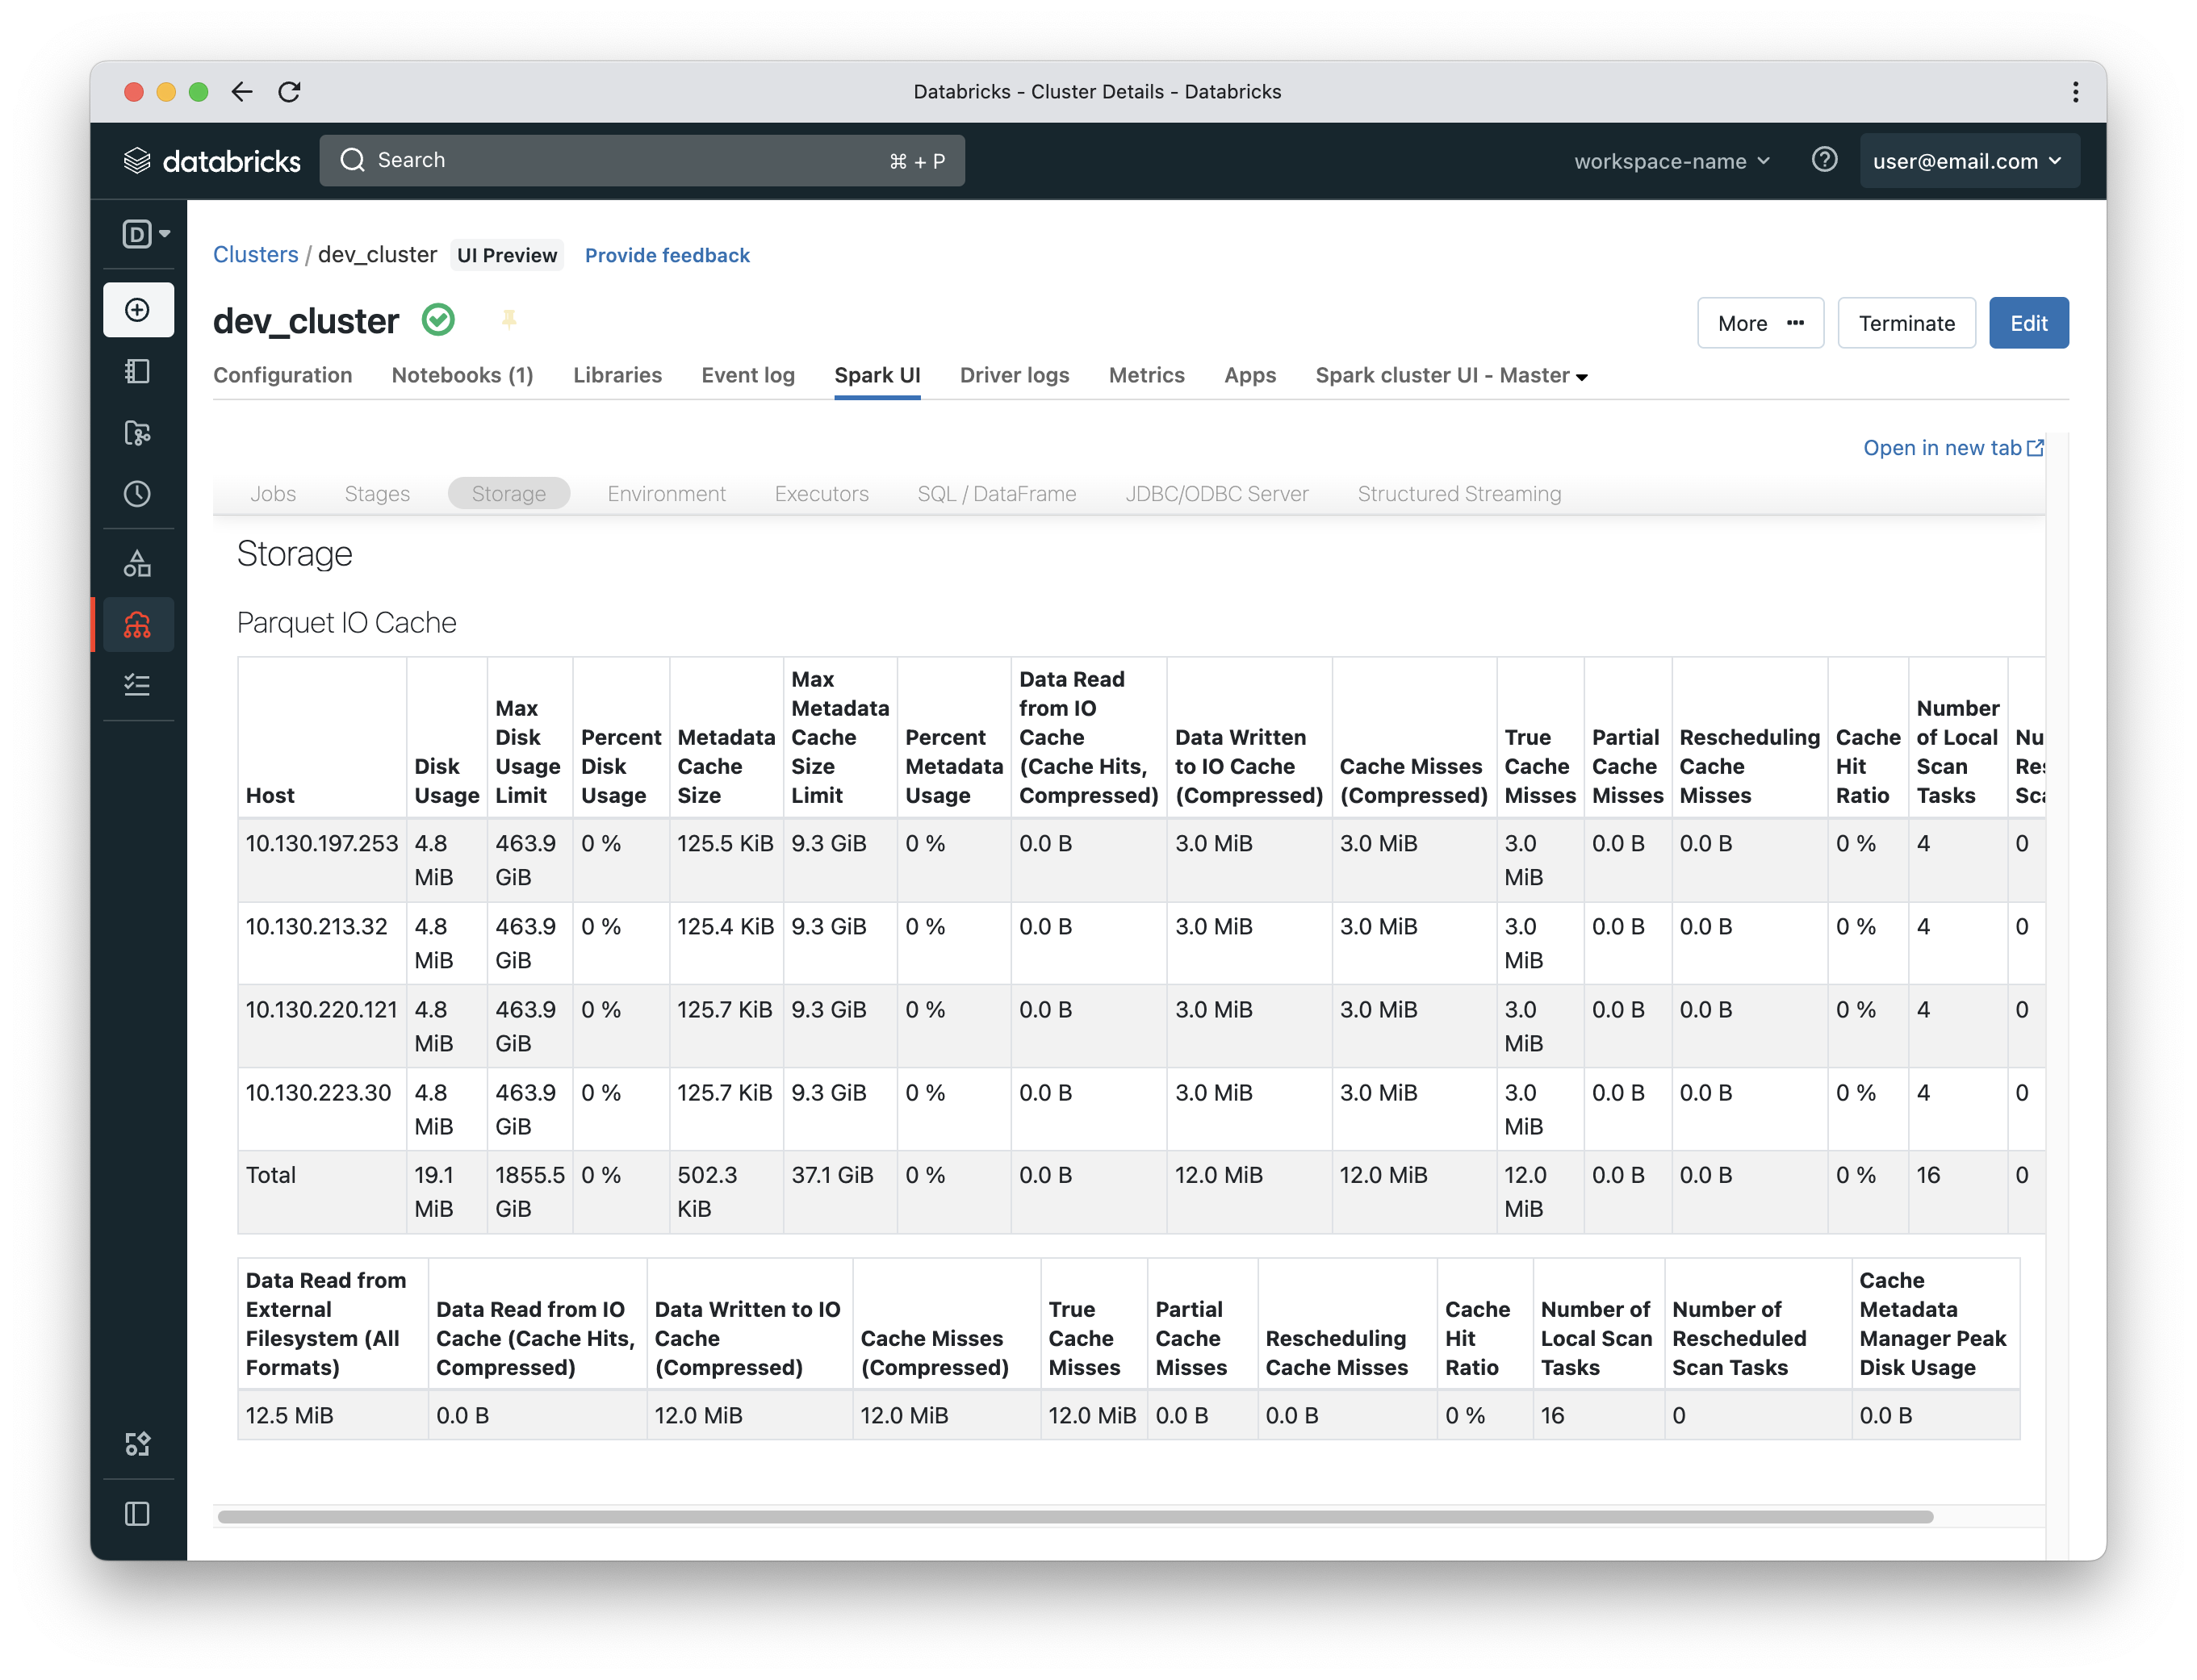
Navigate to Compute in the side menu, select <your-cluster> then Spark UI and finally Storage. You will see something like the below. Numbers could be different depending on your volume of data, but disk cache will appear under a heading called Parquet IO Cache and it will have metrics around the amount of data cached on workers. Notice that the query above took 59 seconds to complete. Please note that a small part of that time could be for Spark to call S3 APIs to enumerate files under a certain S3 location. In such case, you will see the query in running state while no data crunching tasks are executed by worker nodes.
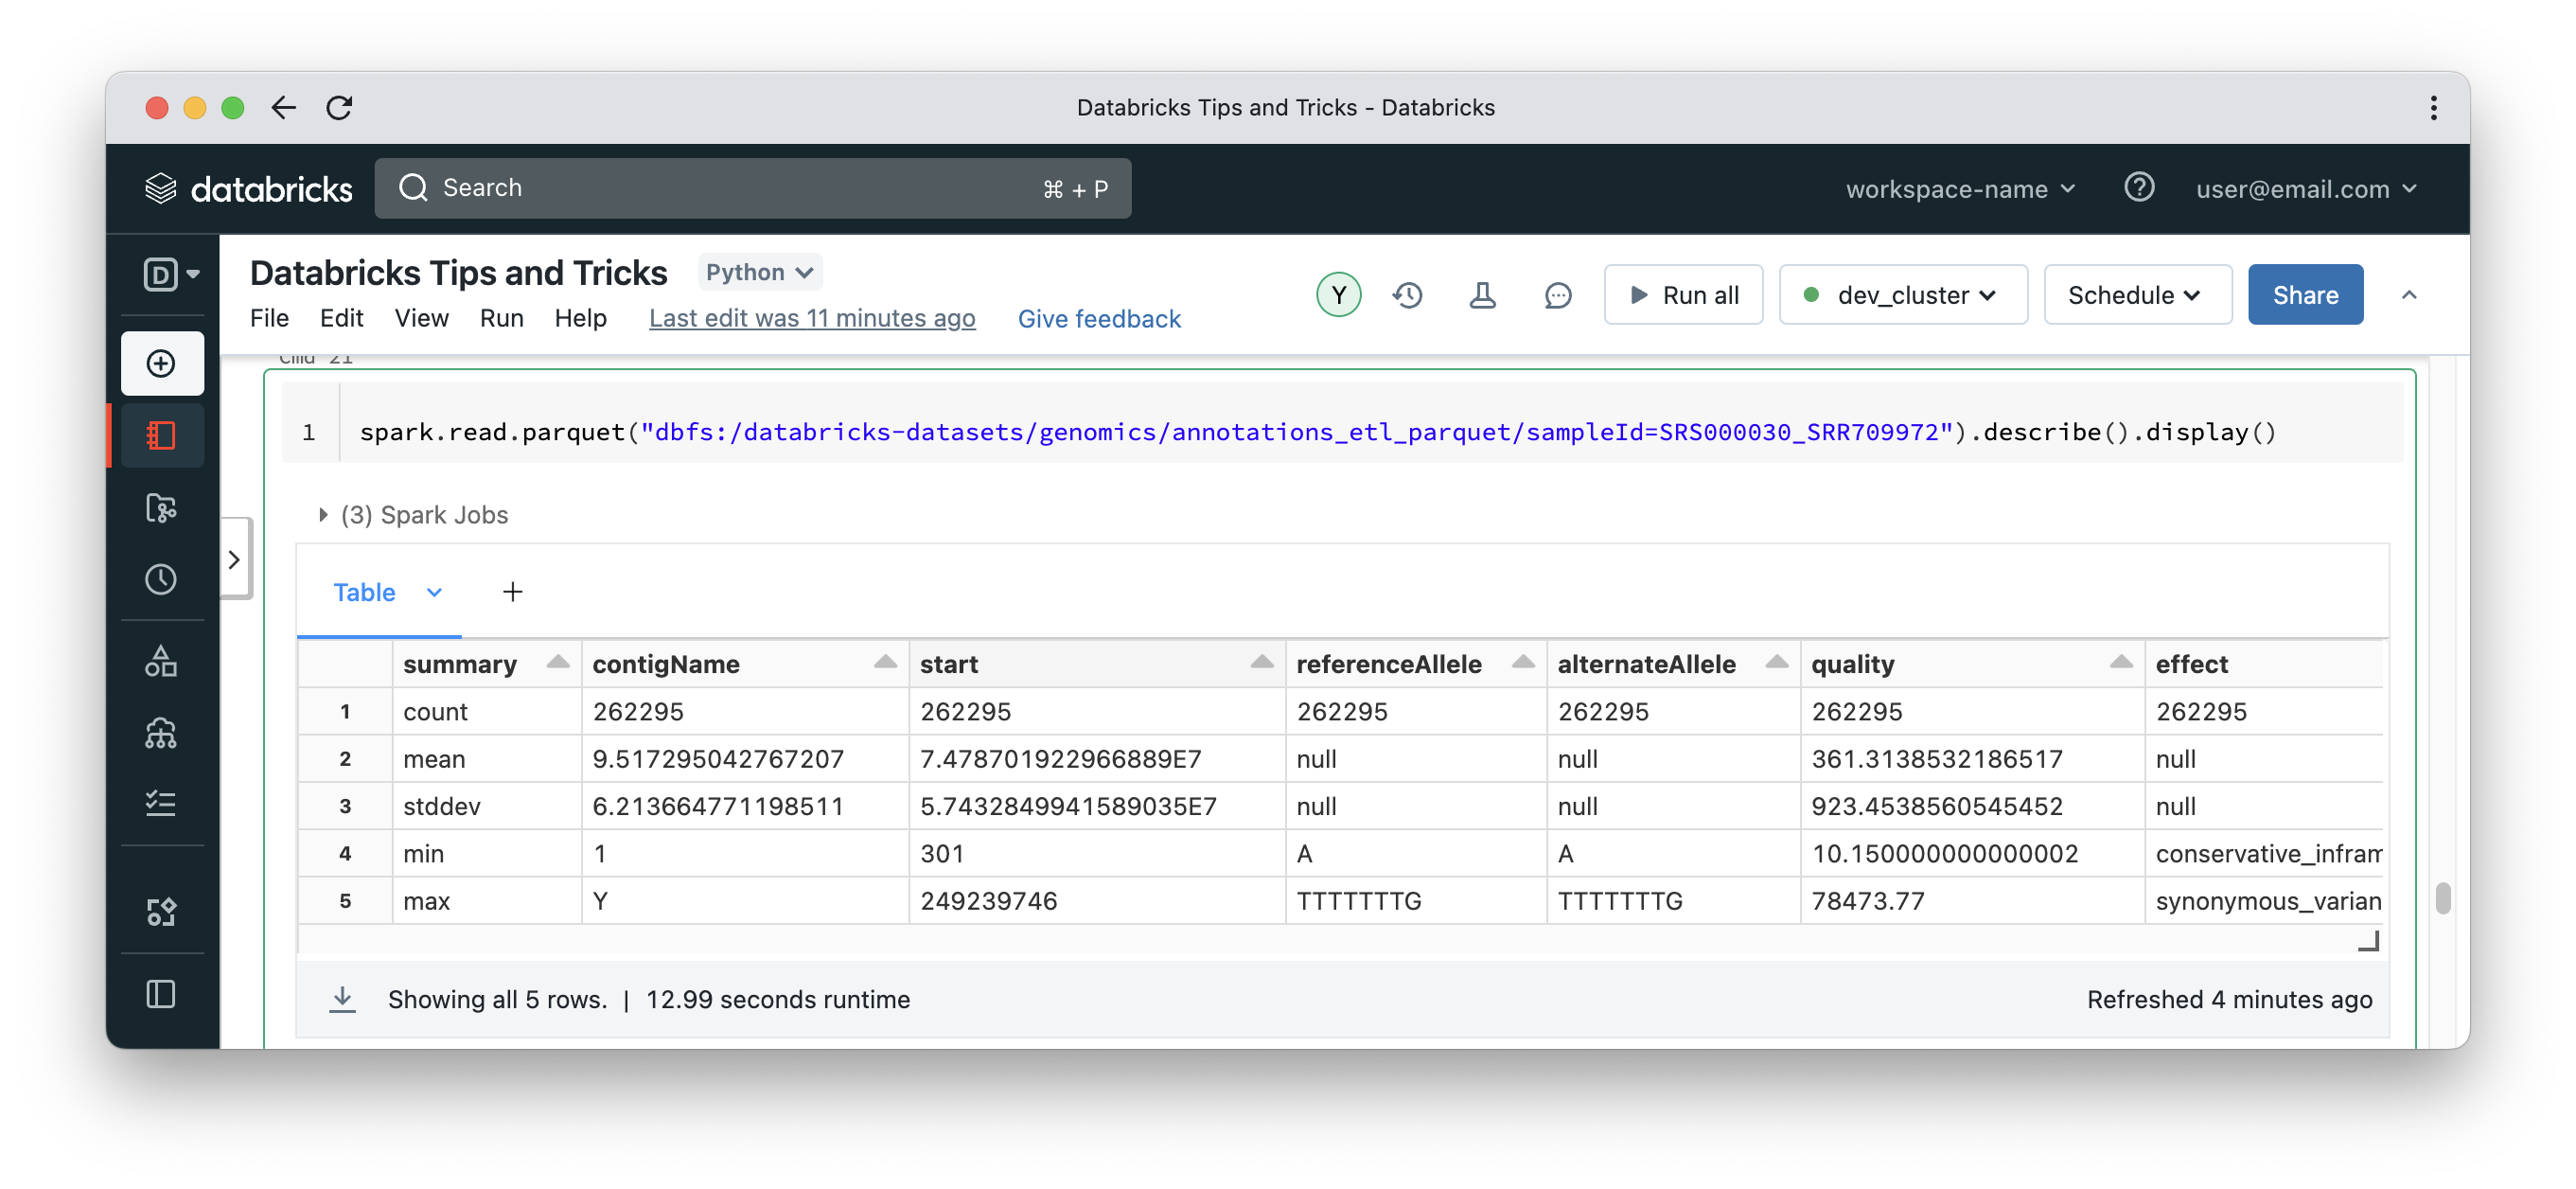
Now that the cache is populated, if we run the same query in another cell, it would be much faster (13 seconds in this case).
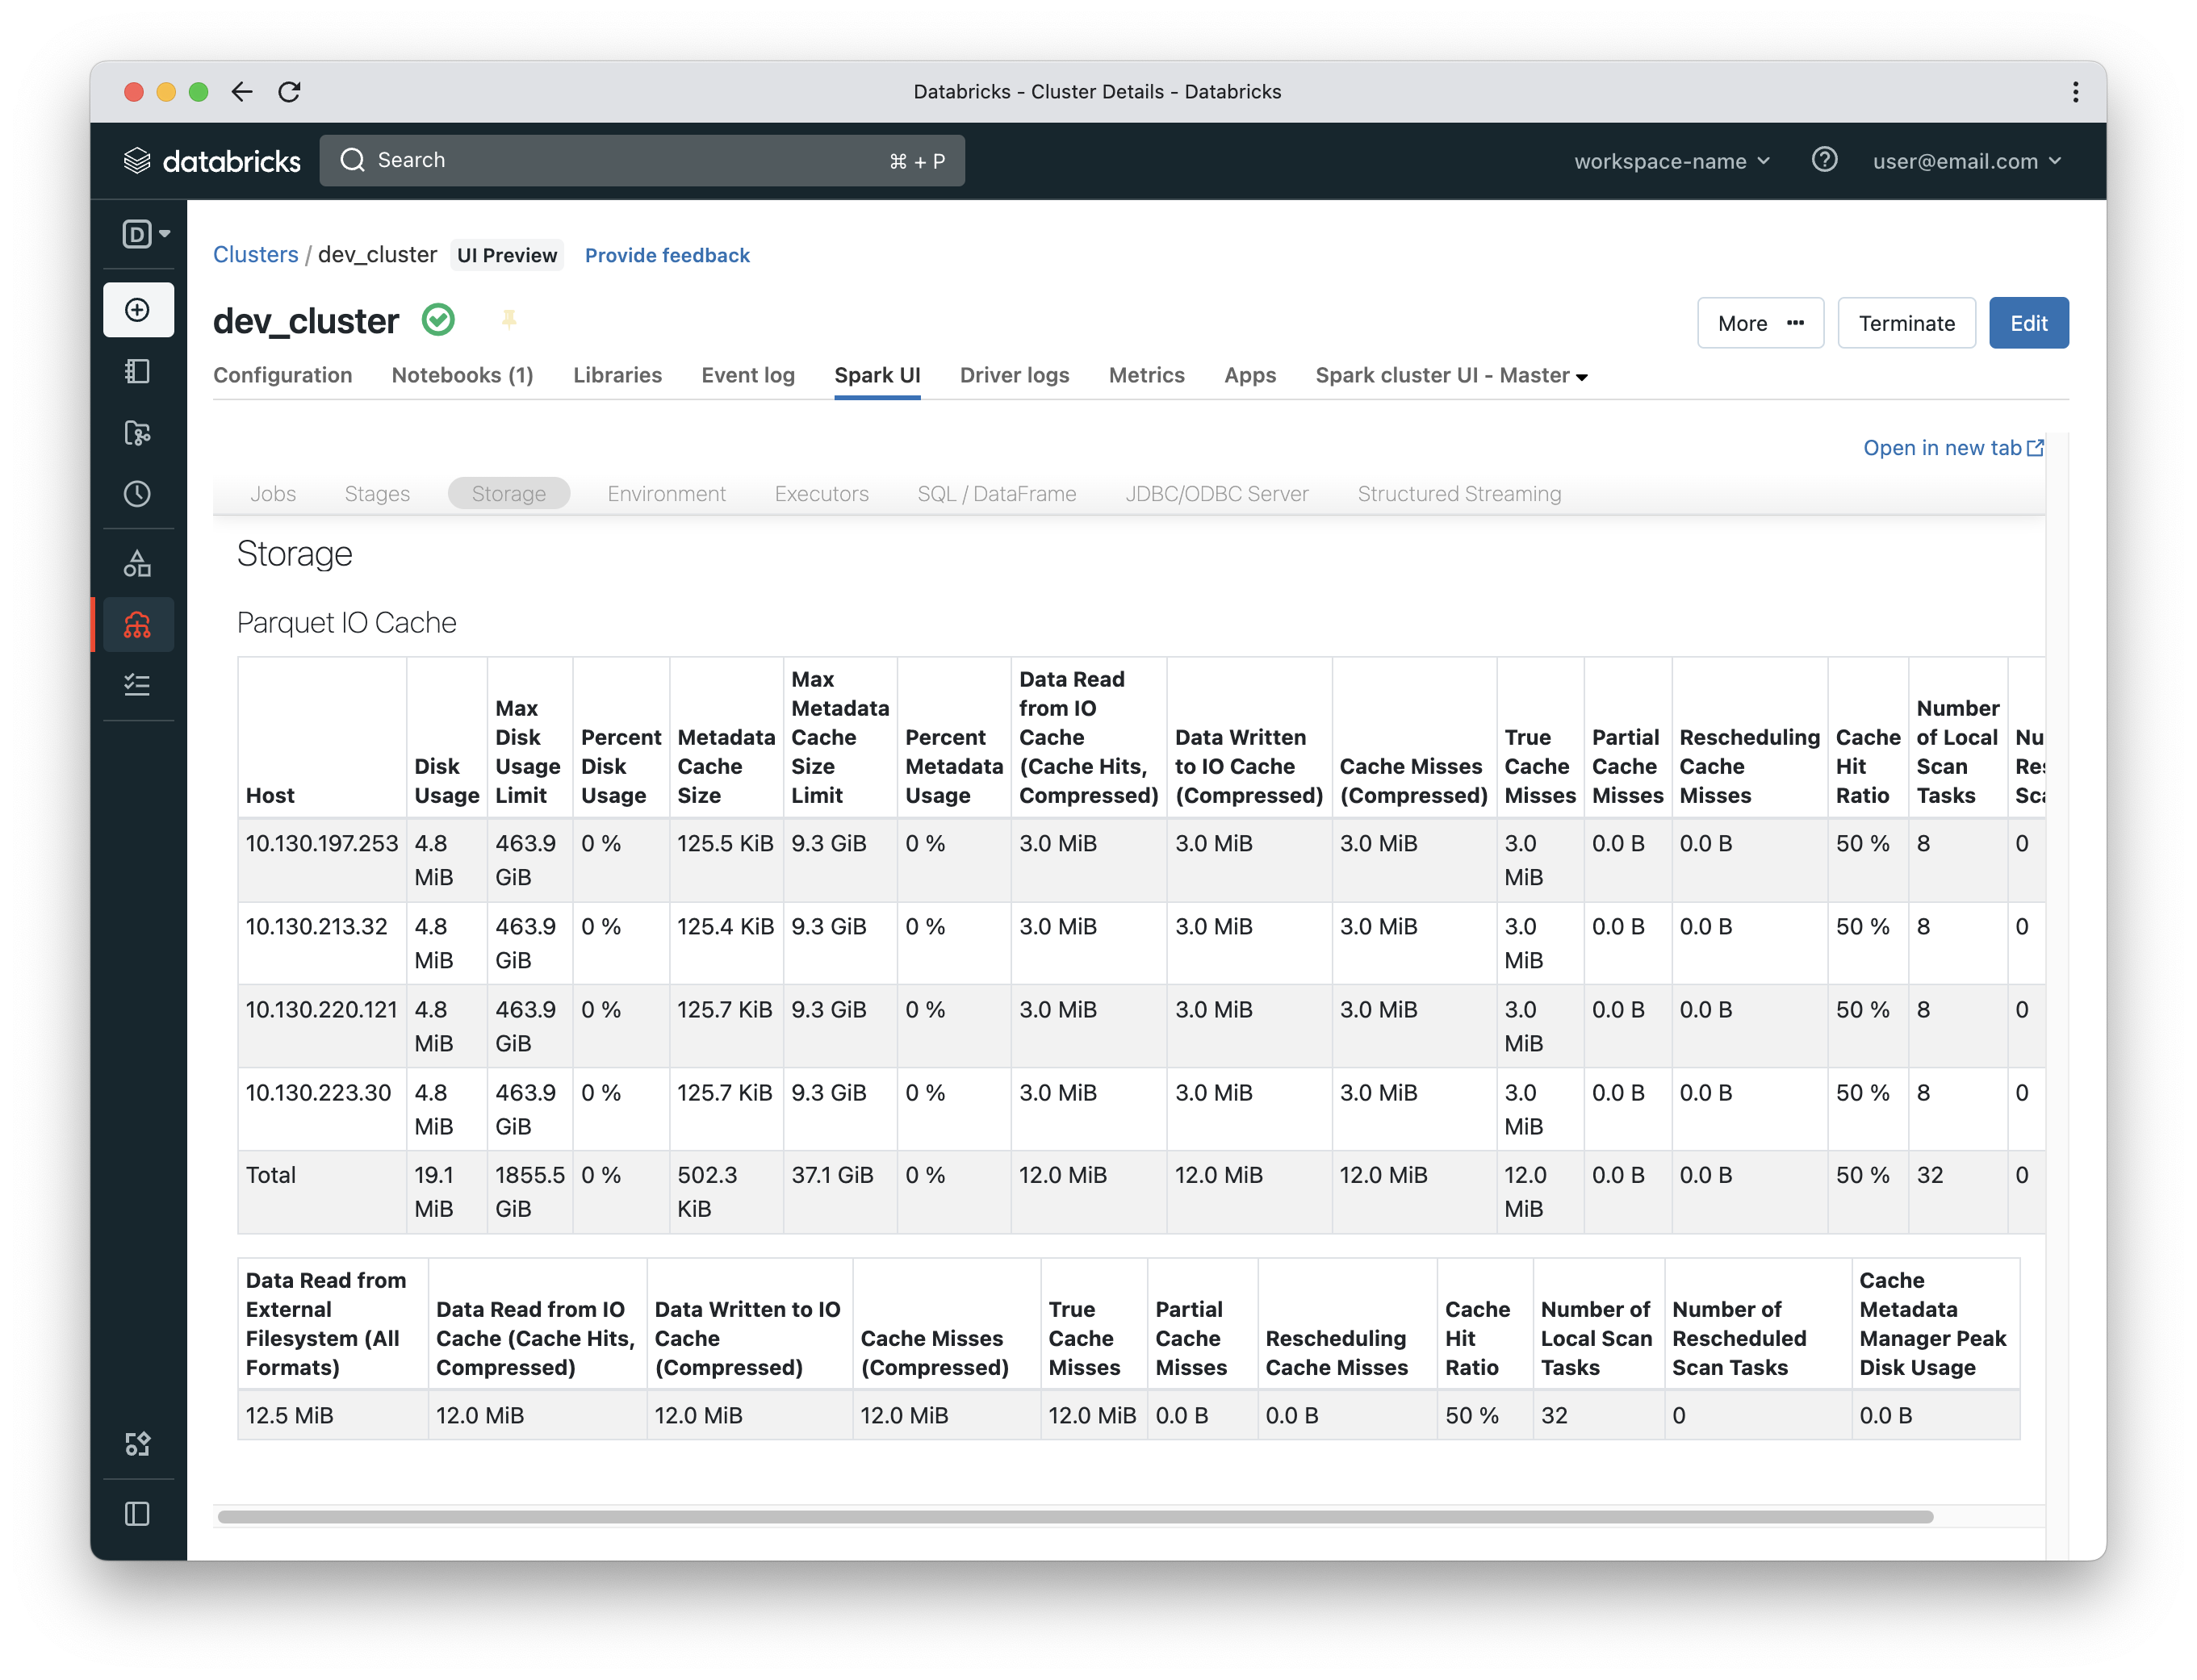
Cache hit ratio will increase to be 50% instead of 0%. It is 50% because the first query was a miss and the second is a hit.
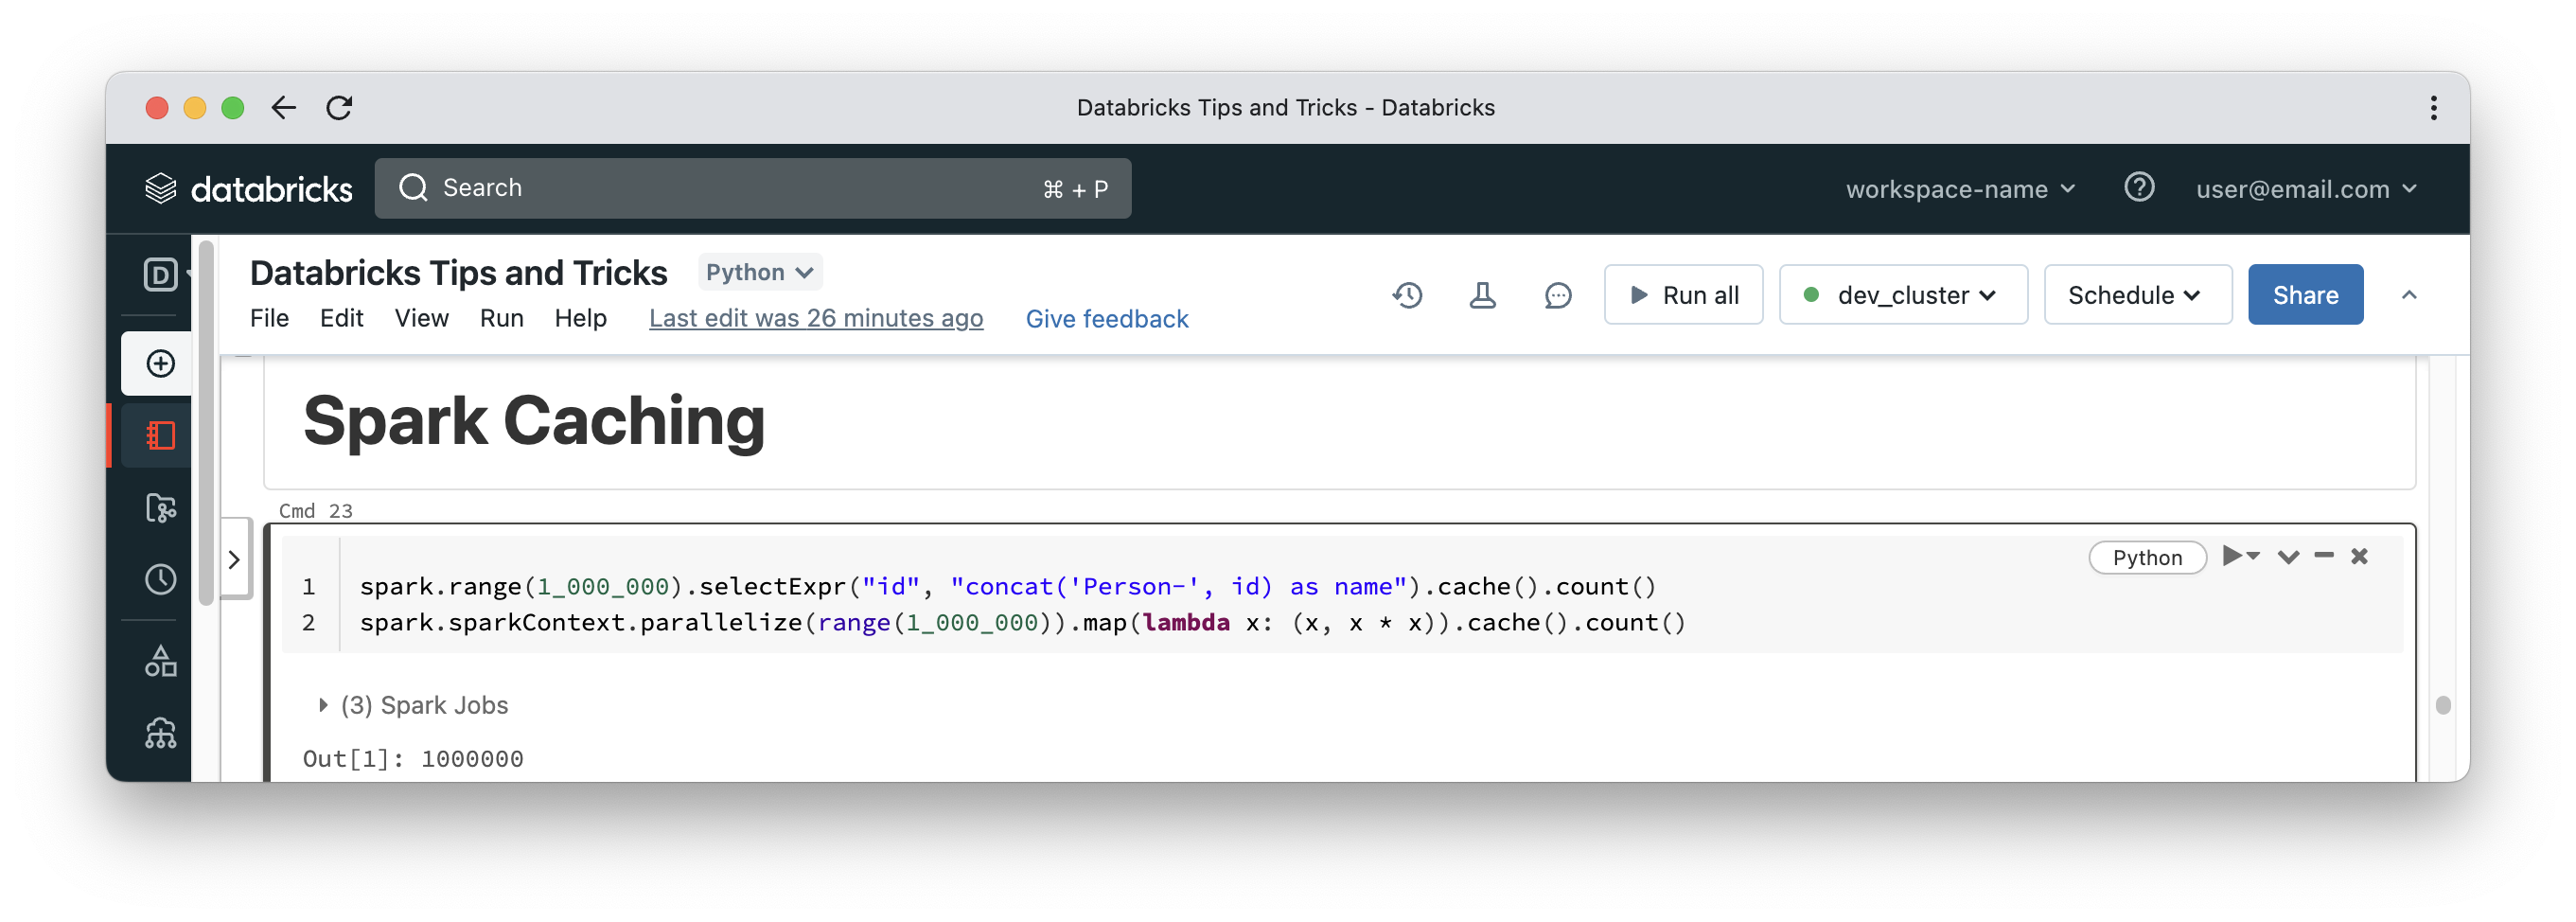
Spark caching – Dataframes vs RDDs.
Because memory is precious and disk capacity is limited, you cannot just cache all data, whether using disk caching or plain Spark caching. It would be nice to verify how much data is cached and whether it makes sense to cache it. Now we will switch from Databricks proprietary disk caching to Spark caching which is available on any Spark installation. Data can be cached in memory, on disk or a combination of both. The cache can also be a serialised or deserialised version of the DataFrame, but in all cases you will get a feeling for data volume. DataFrames are cached with a cache key of the execution plan while RDDs are cached per RDD instance.
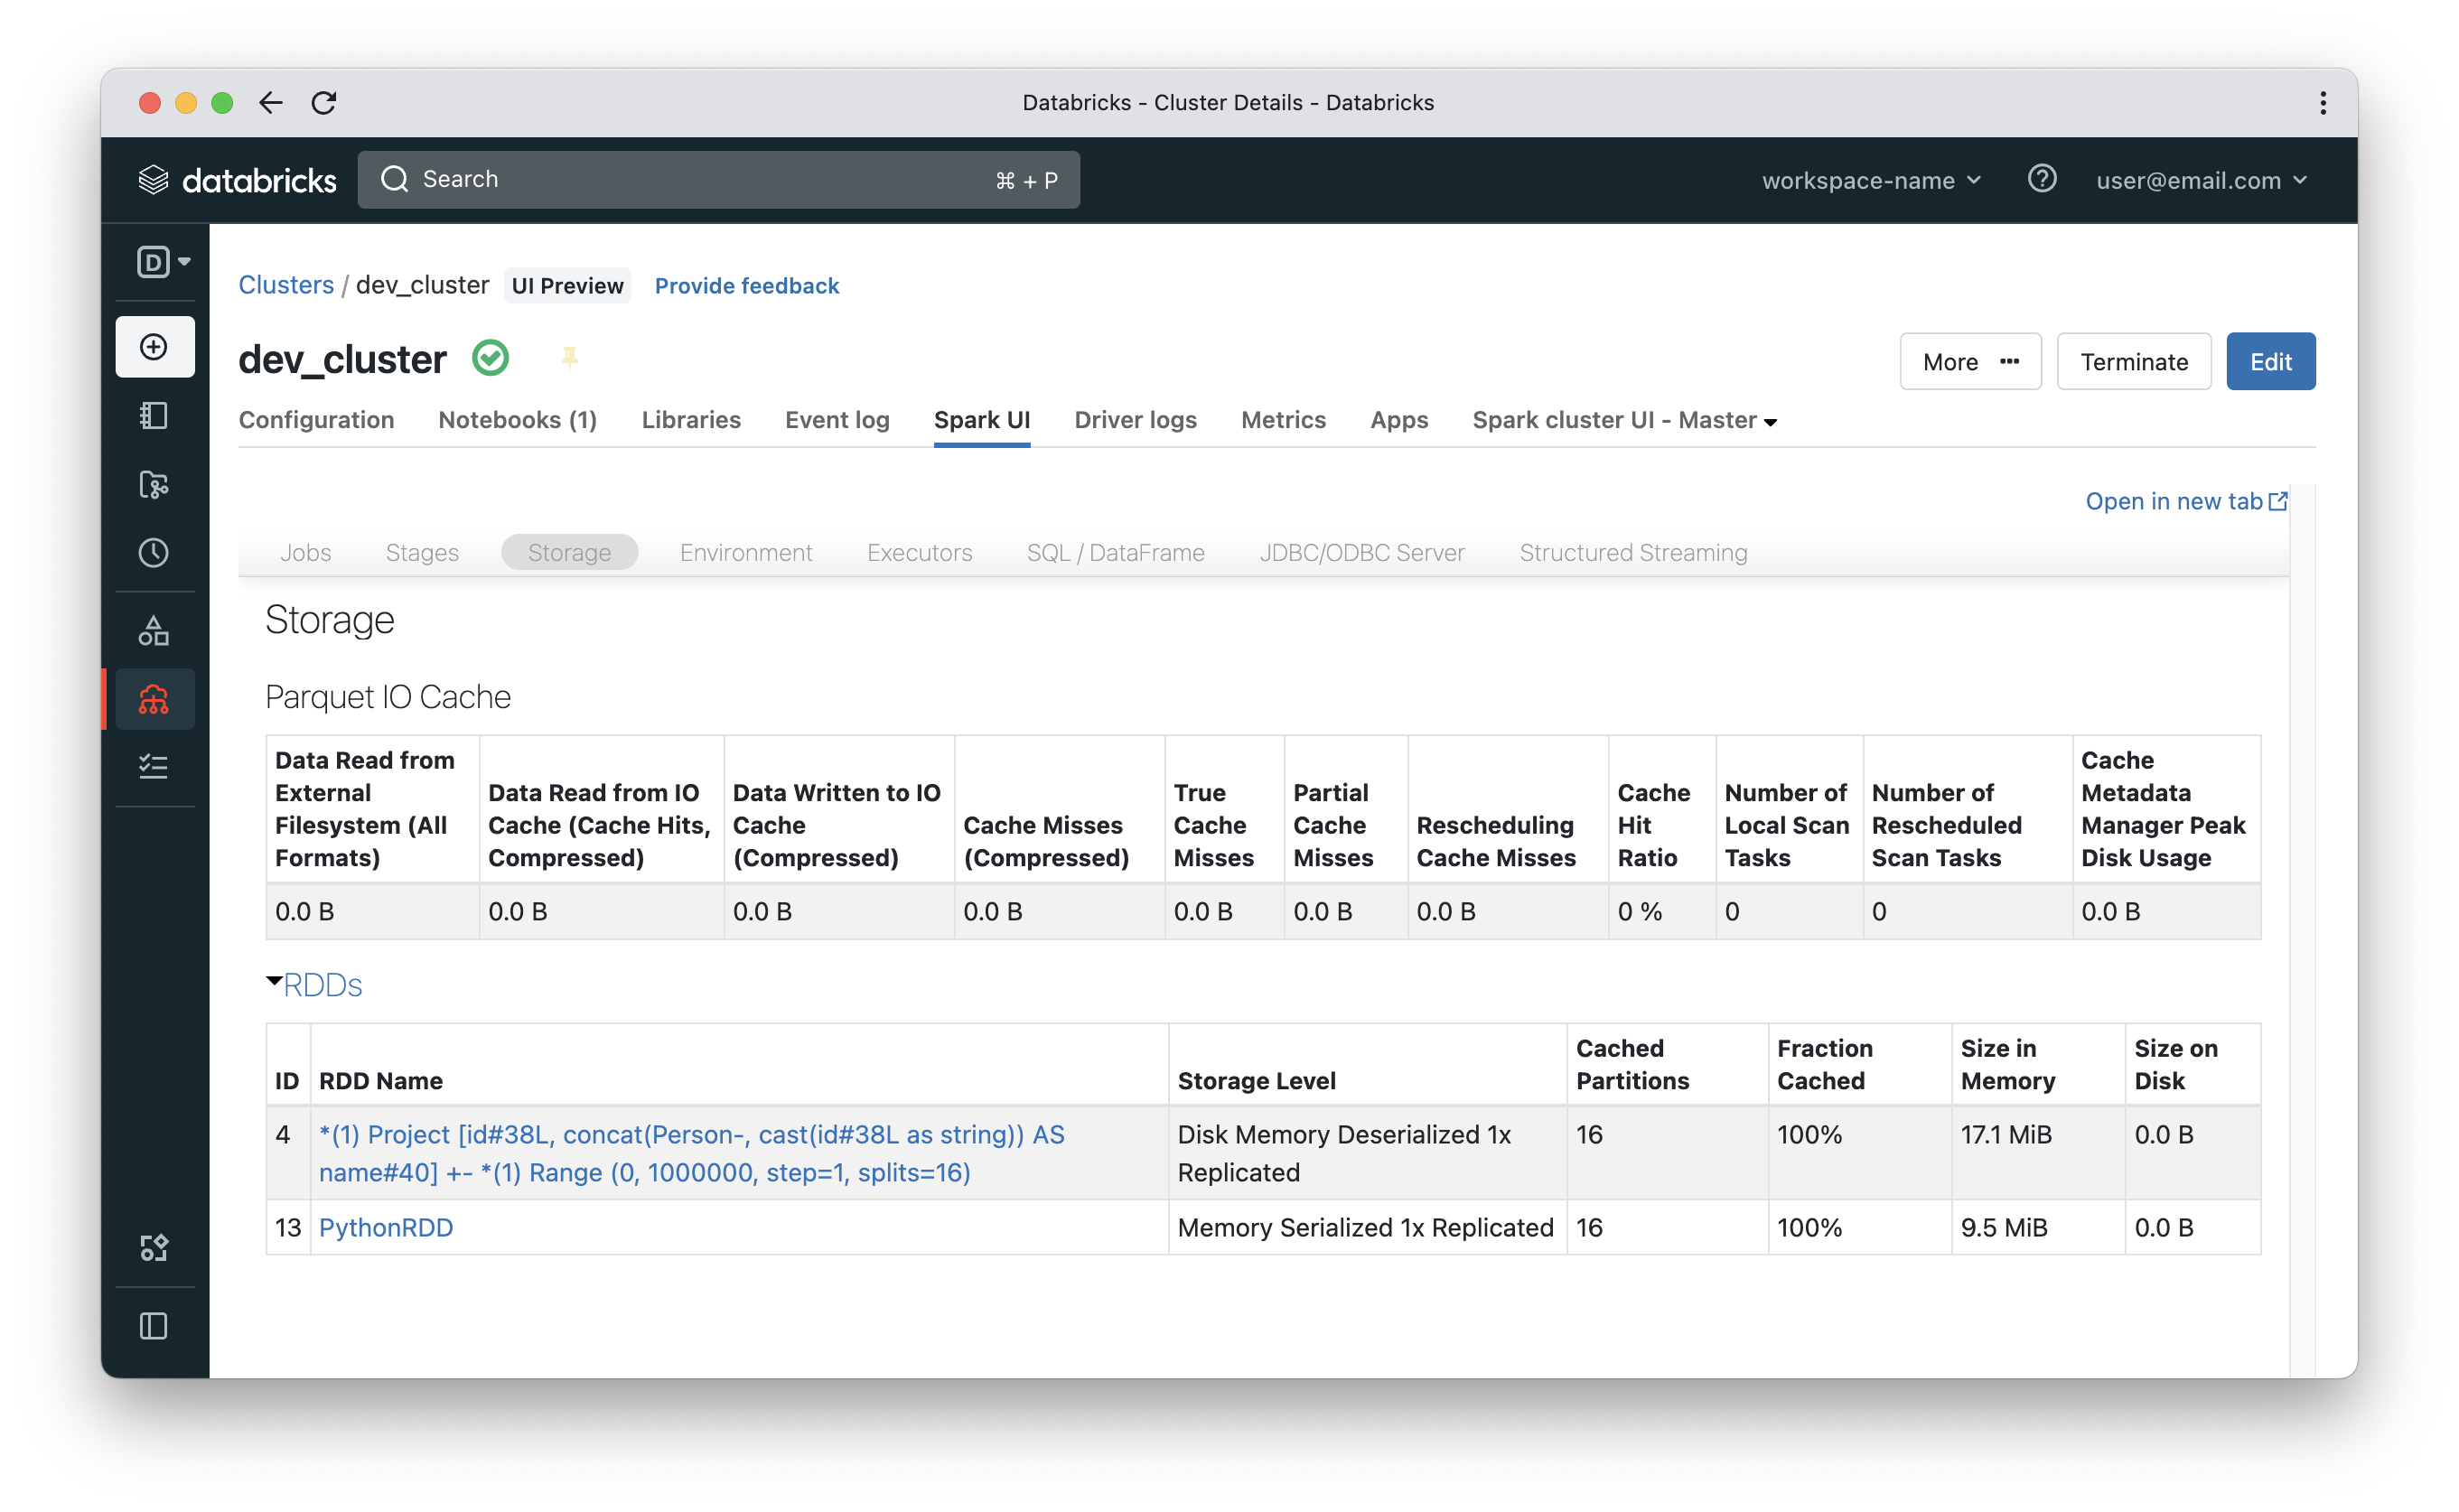
The Spark UI has a storage tab that shows metrics about cached DataFrames and RDDs. Let’s start with a dummy DataFrame and a dummy RDD.
If you navigate to the cluster storage tab again, you will see the Dataframe in the RDDs table but with an RDD name that looks like an execution plan (The cached RDD will have a simpler name). You can click the links in the RDD name column to get more details about the cached data, such as how much is cached on disk vs memory, and information about the distribution of cached data on worker nodes. The key takeaway here is how to inspect the volume of data cached and to always remember that DataFrames are cached based on an execution plan. So, if you read some data after a few cells in the notebook and that read operation produces the same execution plan as an already cached Dataframe, then the data will be loaded from cache, not from disk.
Ganglia
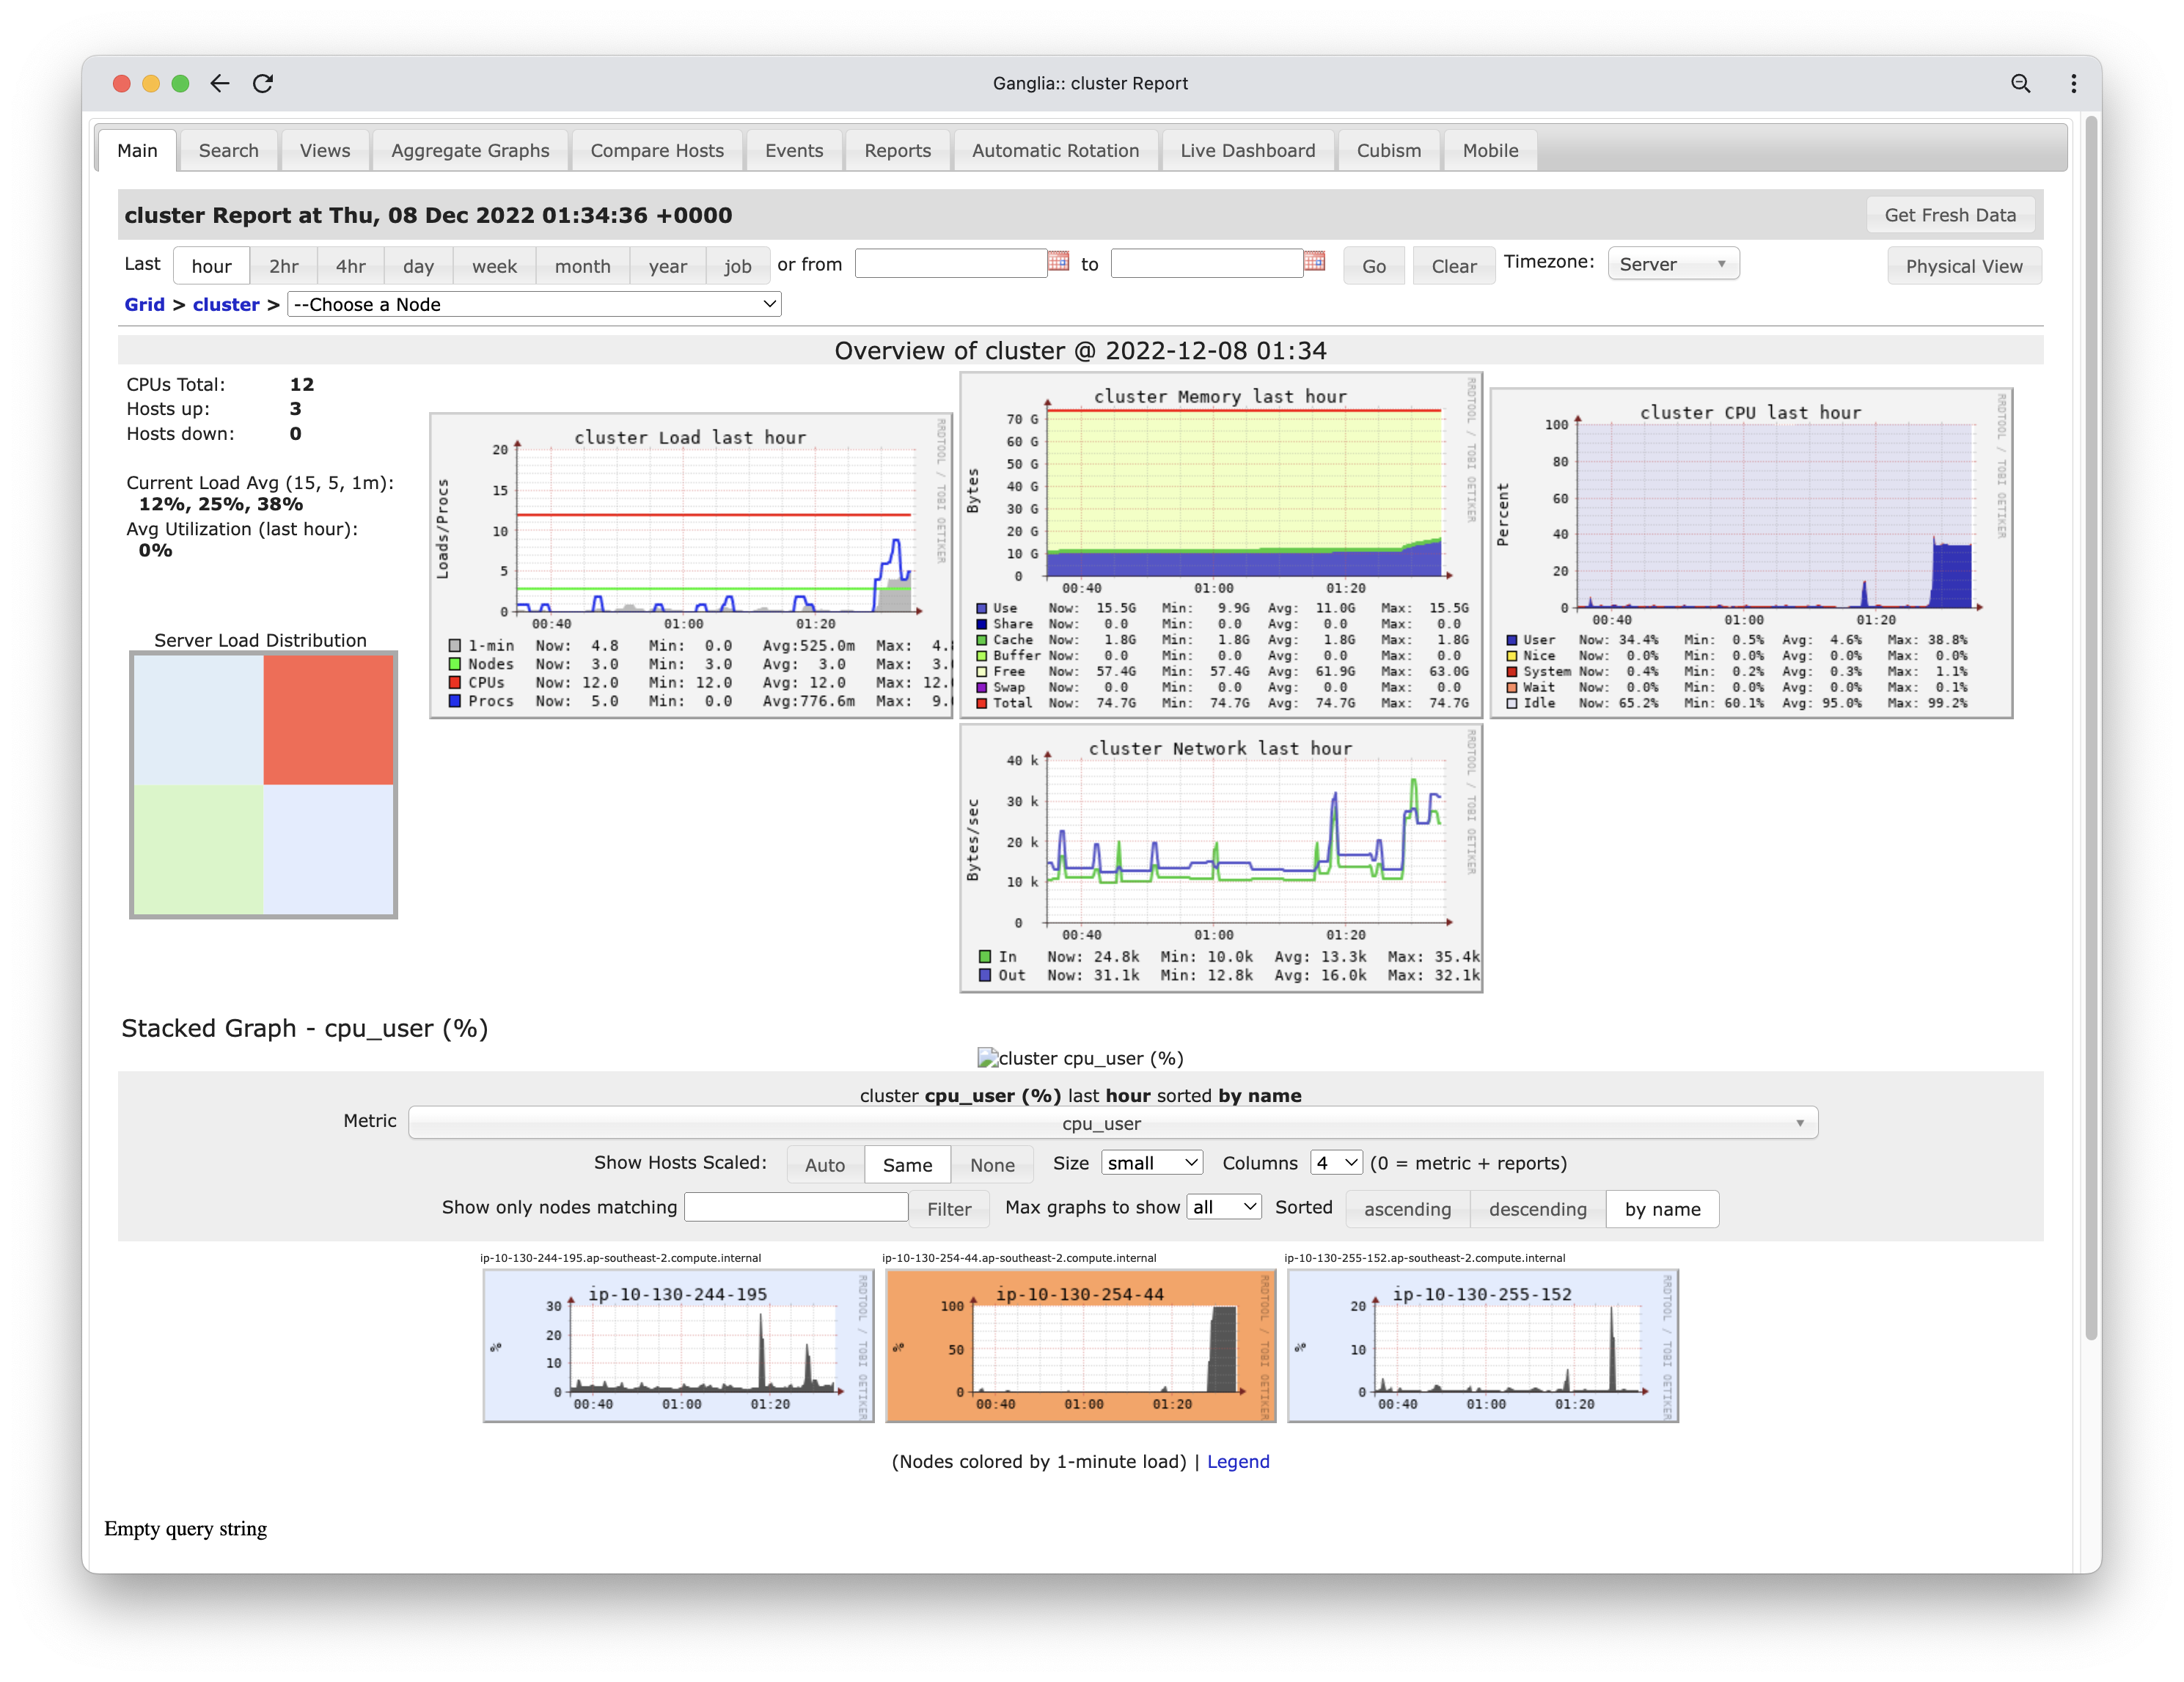
How many times you had a long running Spark job and had no clue if the cluster is really doing anything or if there is some skew or any task stragglers? Spark UI is very powerful, but it would also be useful to have a dashboard, just like your car dashboard, so you can visually get a feel for if everything is good, or if there is something obvious that needs to be fixed. The Ganglia dashboard does this by providing lots of metrics, both cumulative and per worker node. You can access the dashboard from Spark UI >> Metrics >> Ganglia UI.
The following snippet simulates one worker under heavy load:
- We start with a UDF that can add an executor Id to records in a DataFrame
- Then, using the array_repeat & explode functions, we are able to generate a vastly greater number of records on one worker compared to the other(s)
- The acos function is used to just trigger some CPU utilisation (anything that puts load on CPU can be used)
- And finally, write mode “noop” is the way to benchmark a query without writing output to disk
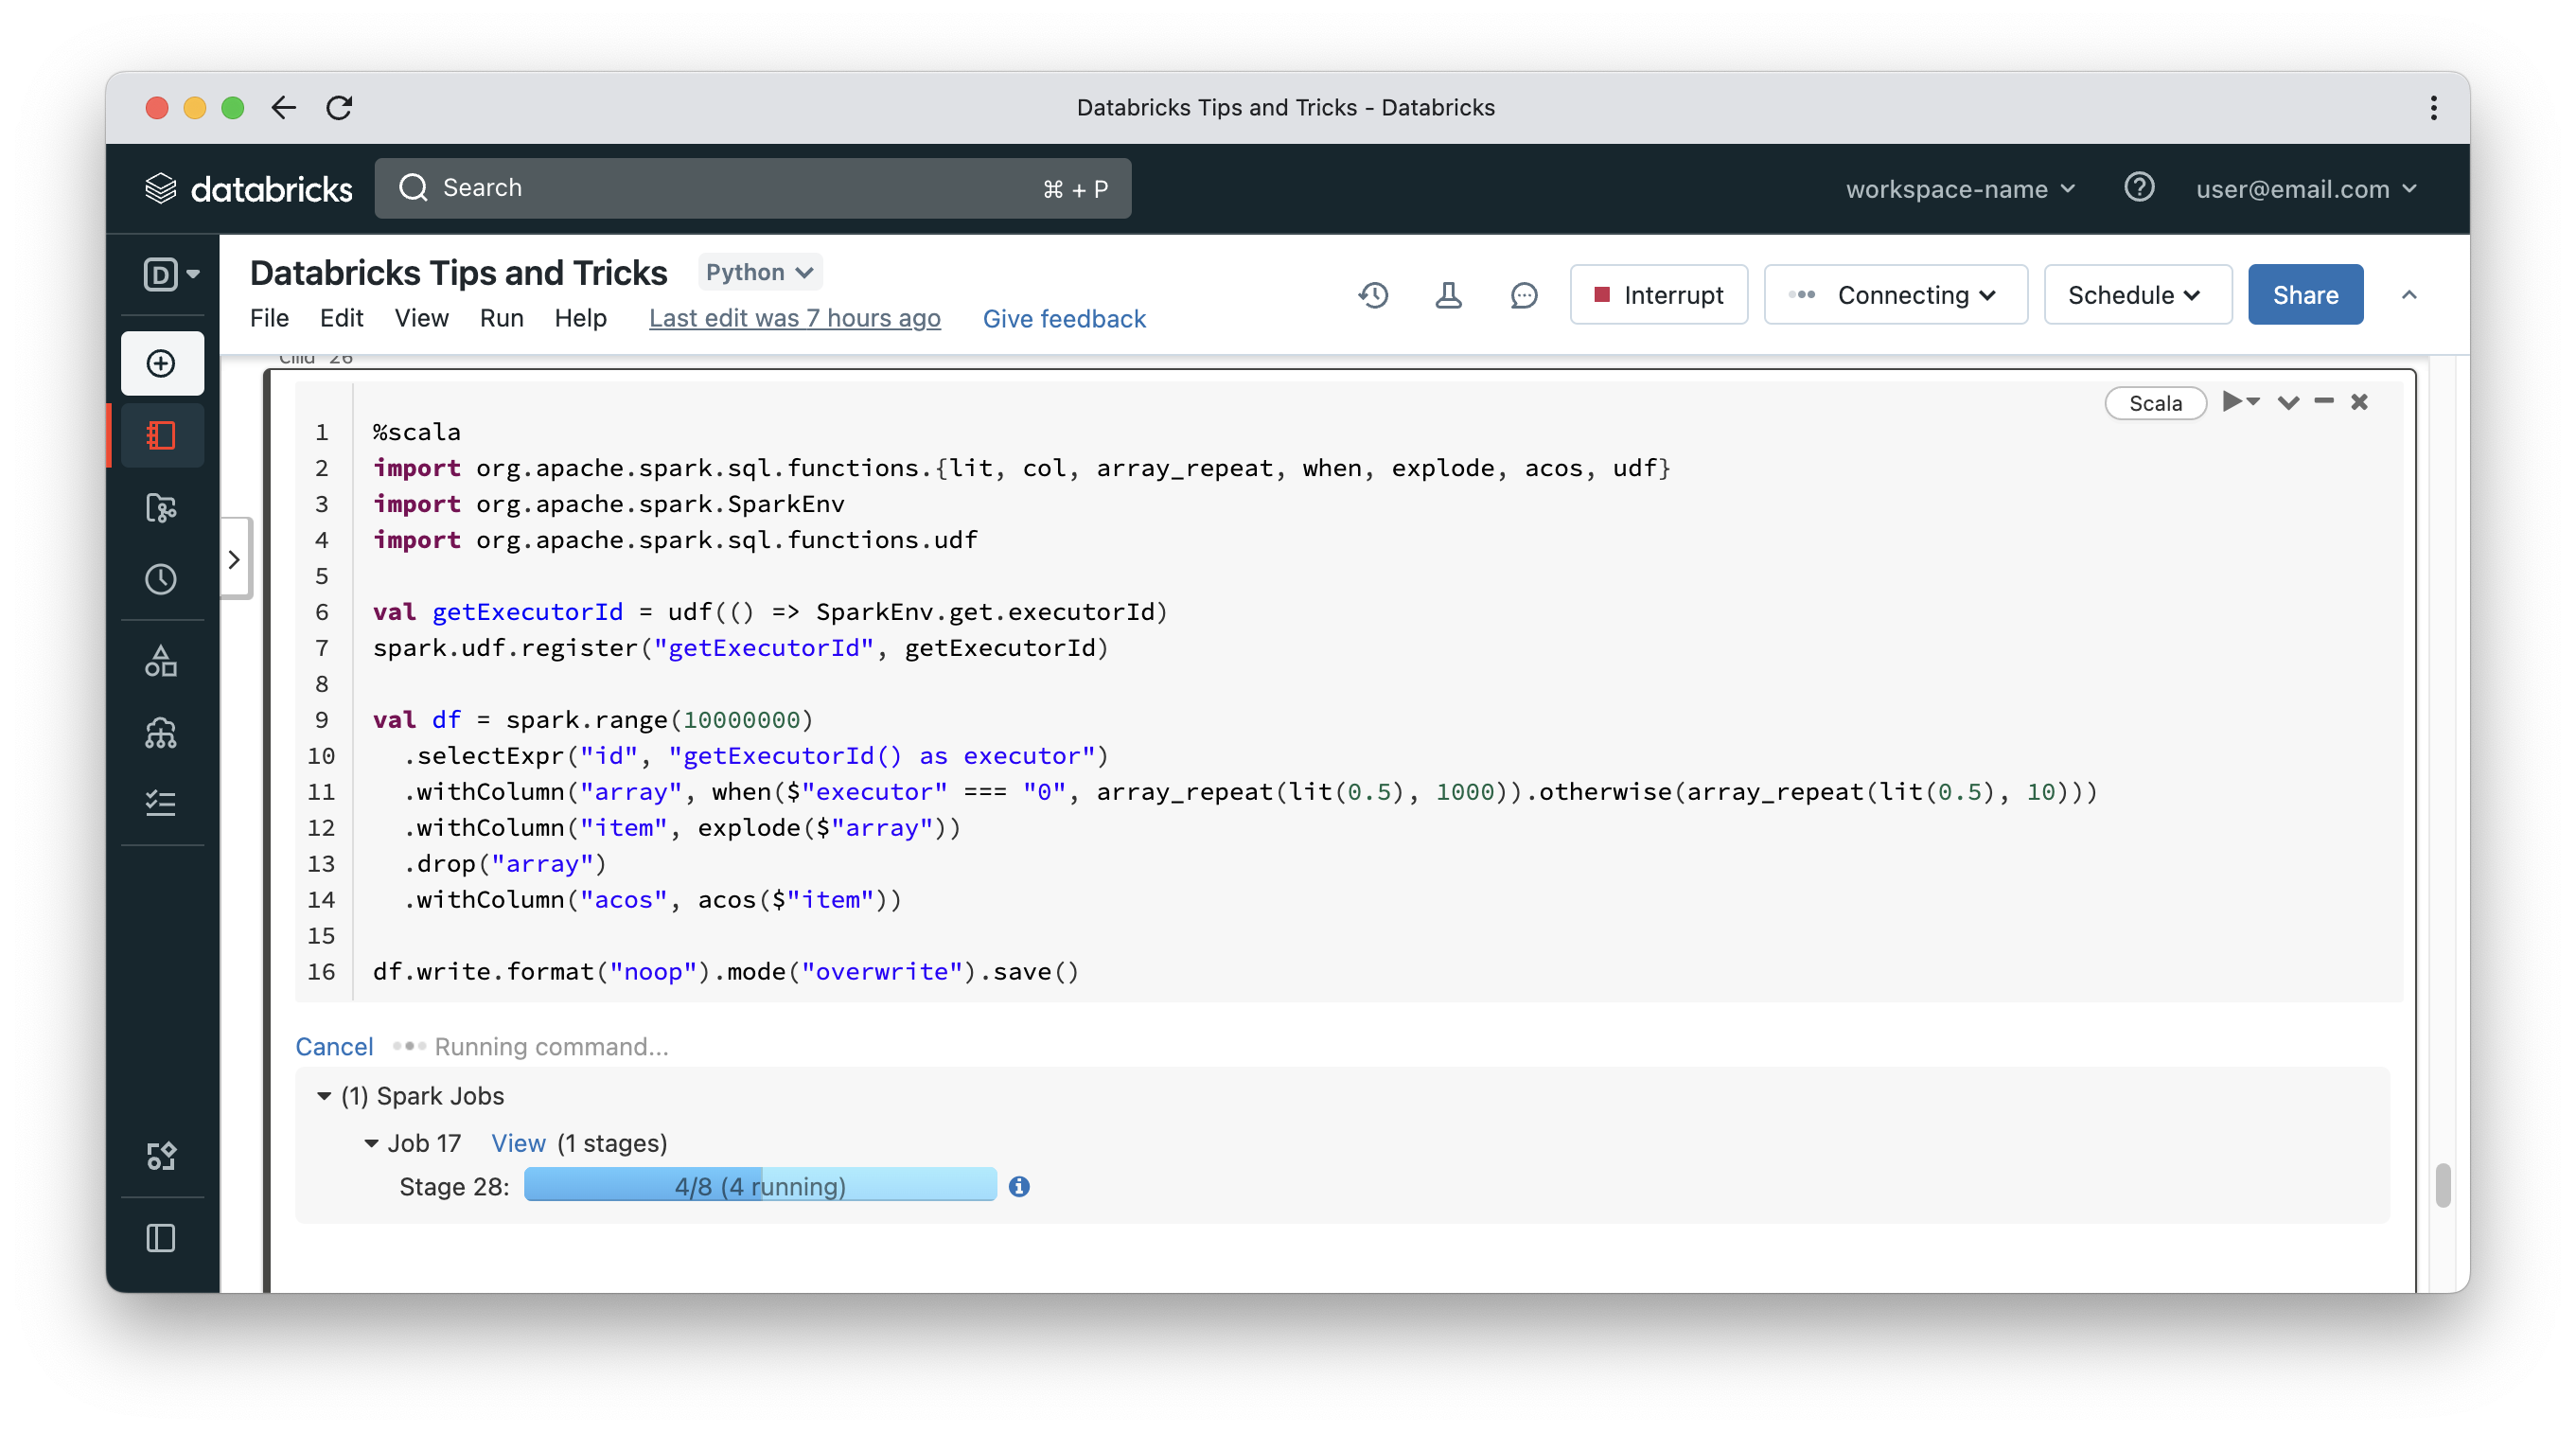
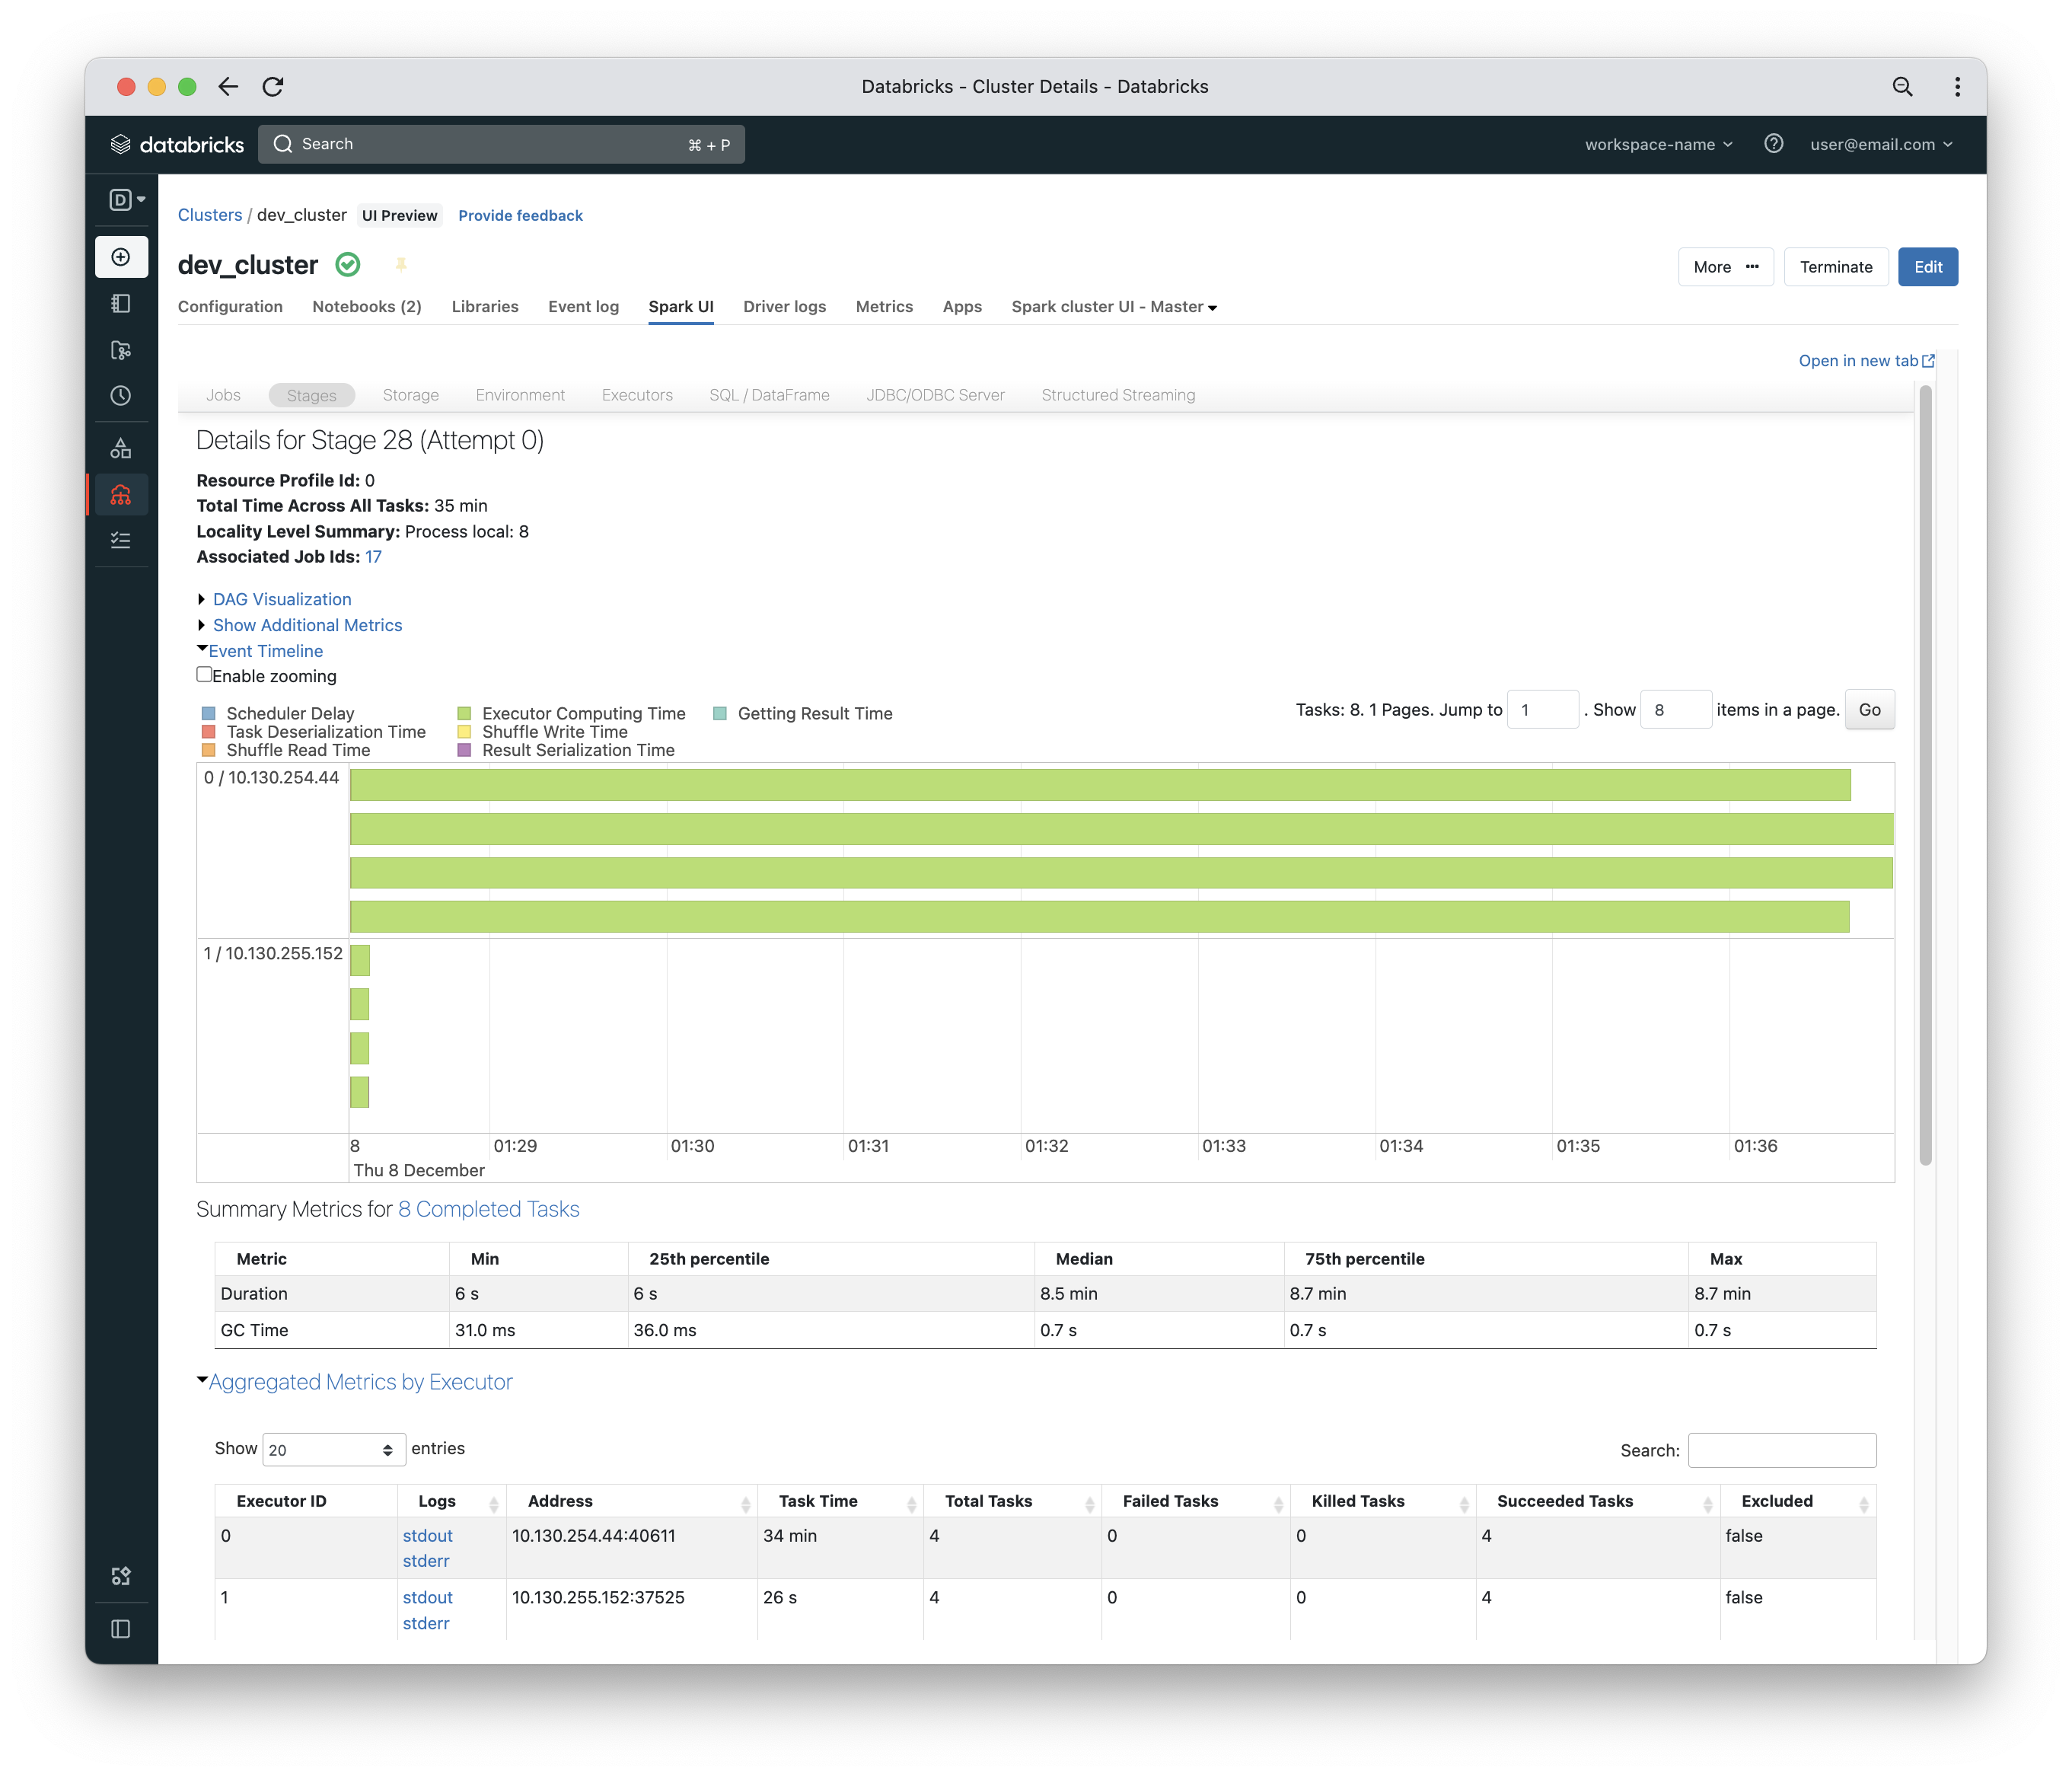
As you can see from the screenshot above, there are 8 tasks for this Spark job – 4 of them are complete and the others are still in progress. The Ganglia dashboard shows one worker node under heavy load (red box in server load utilisation section). Additionally, the Worker CPU section at the bottom of the dashboard shows one worker exhibiting high CPU utilisation (the orange box).
Once the job is complete, you can inspect the single stage of that job. It is a single stage because the job is a group of back-to-back narrow transformations and there is no shuffling taking place. The key point is that some tasks (the ones on worker 0) have much more data to crunch than the tasks on worker 1 – that is very apparent based on the event timeline section of the stage details.
Cluster Tips
Cluster access mode
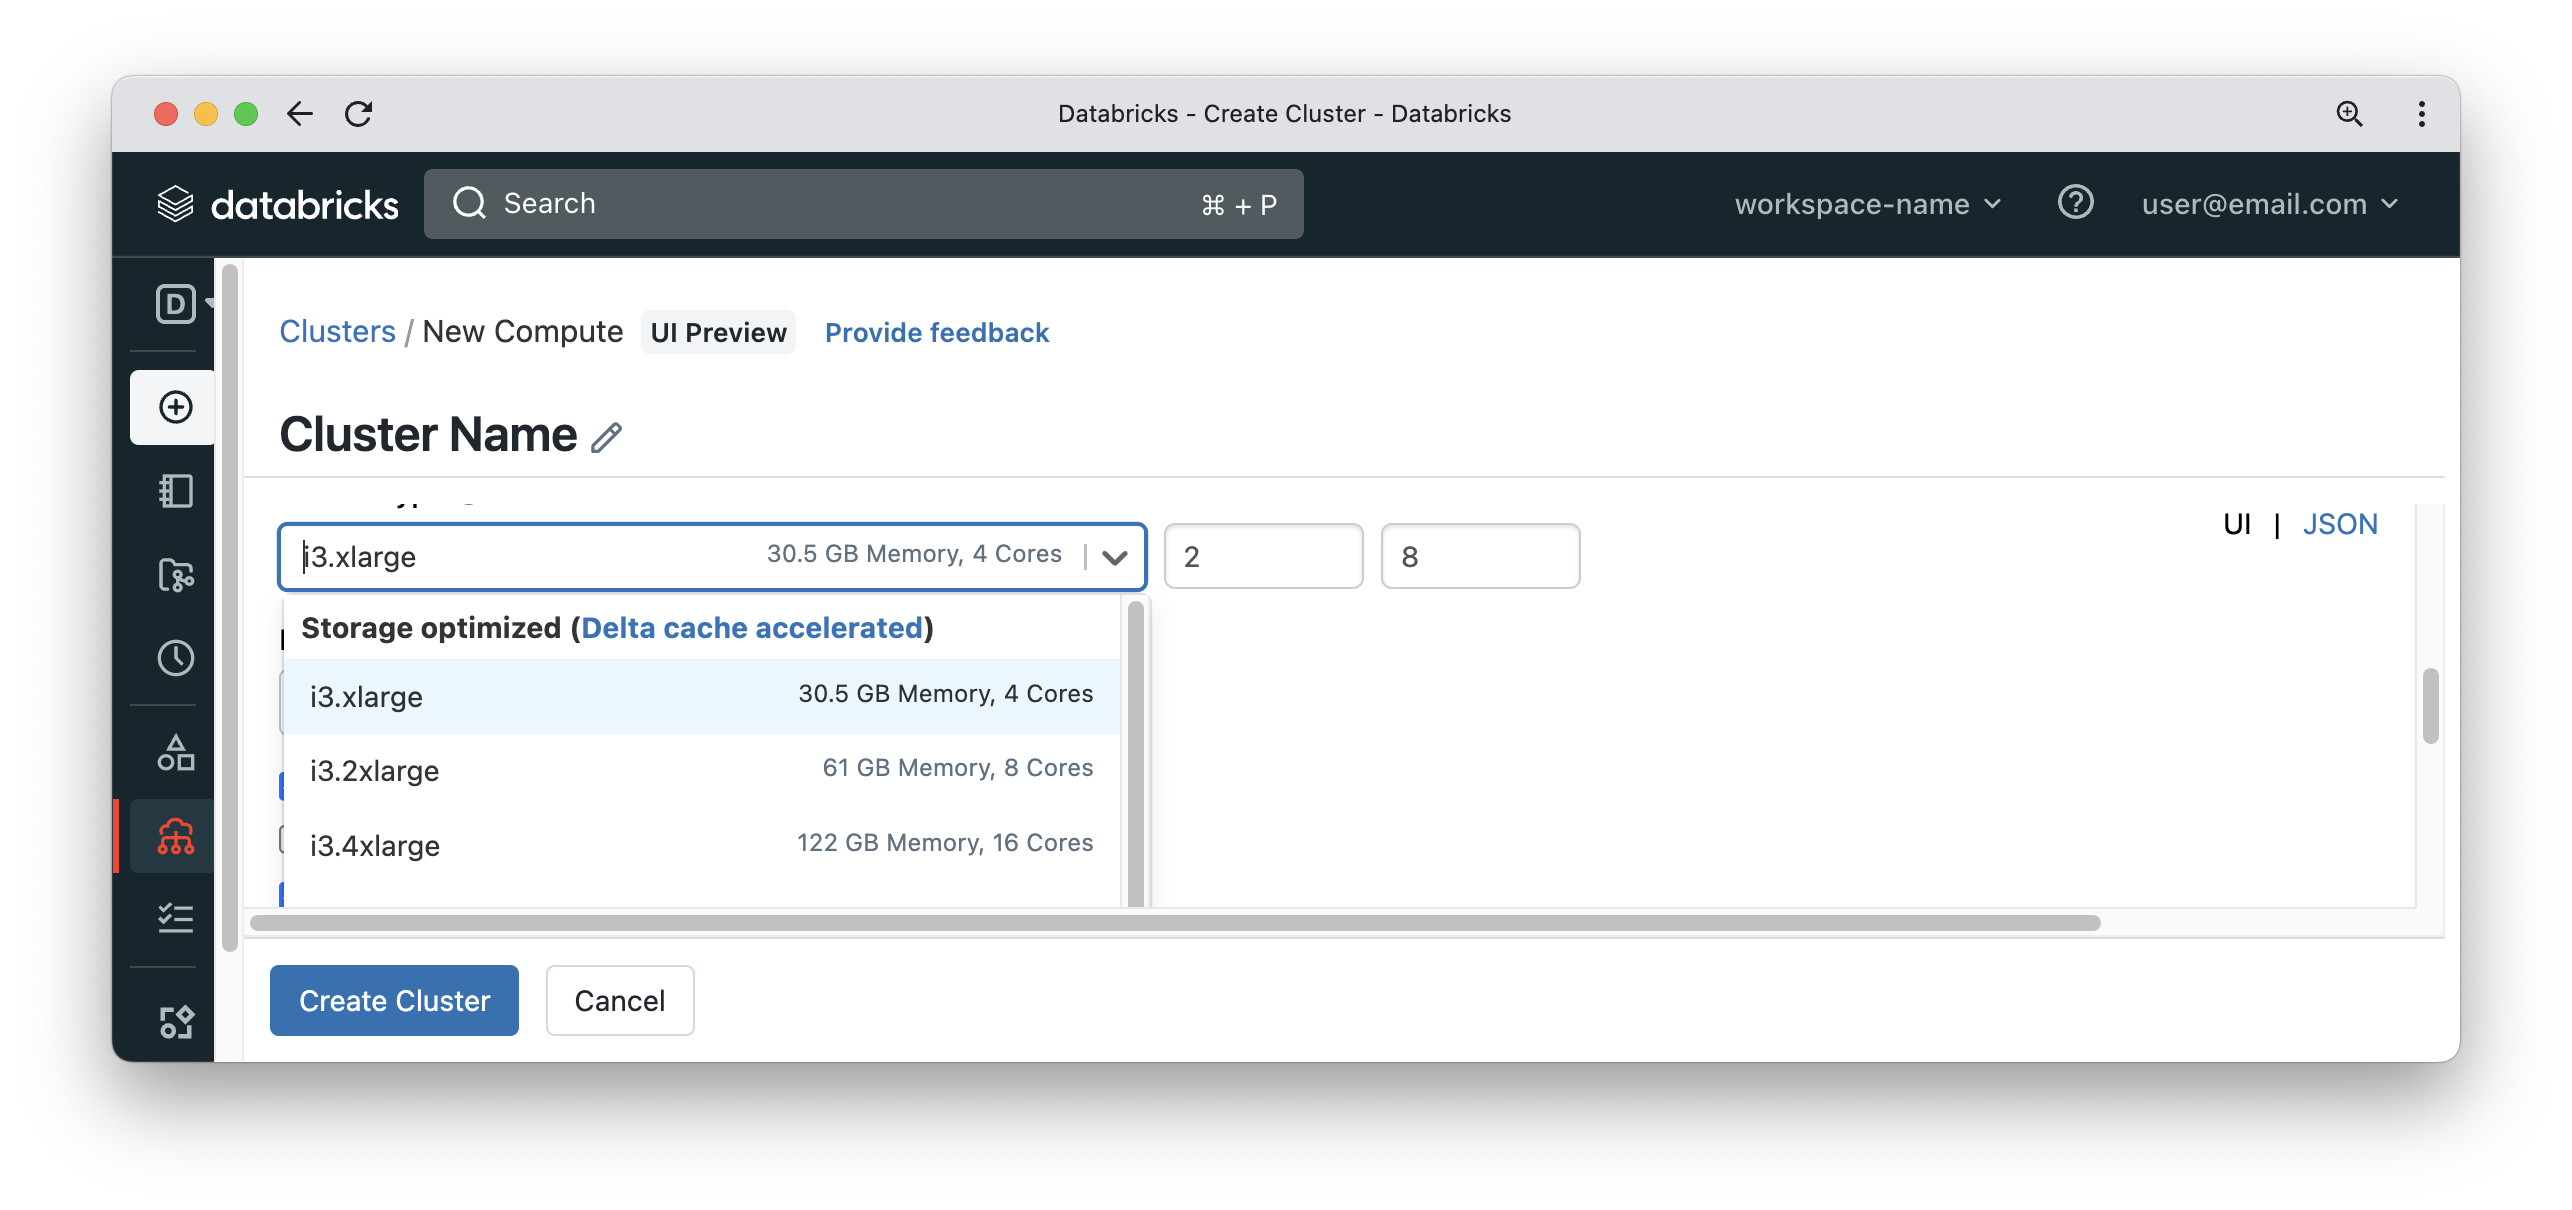
A cluster on Databricks can be used by a single user or a team of users operating in a shared capacity. The old setting of standard & high concurrency clusters has been replaced with cluster access mode with the introduction of Unity Catalog.
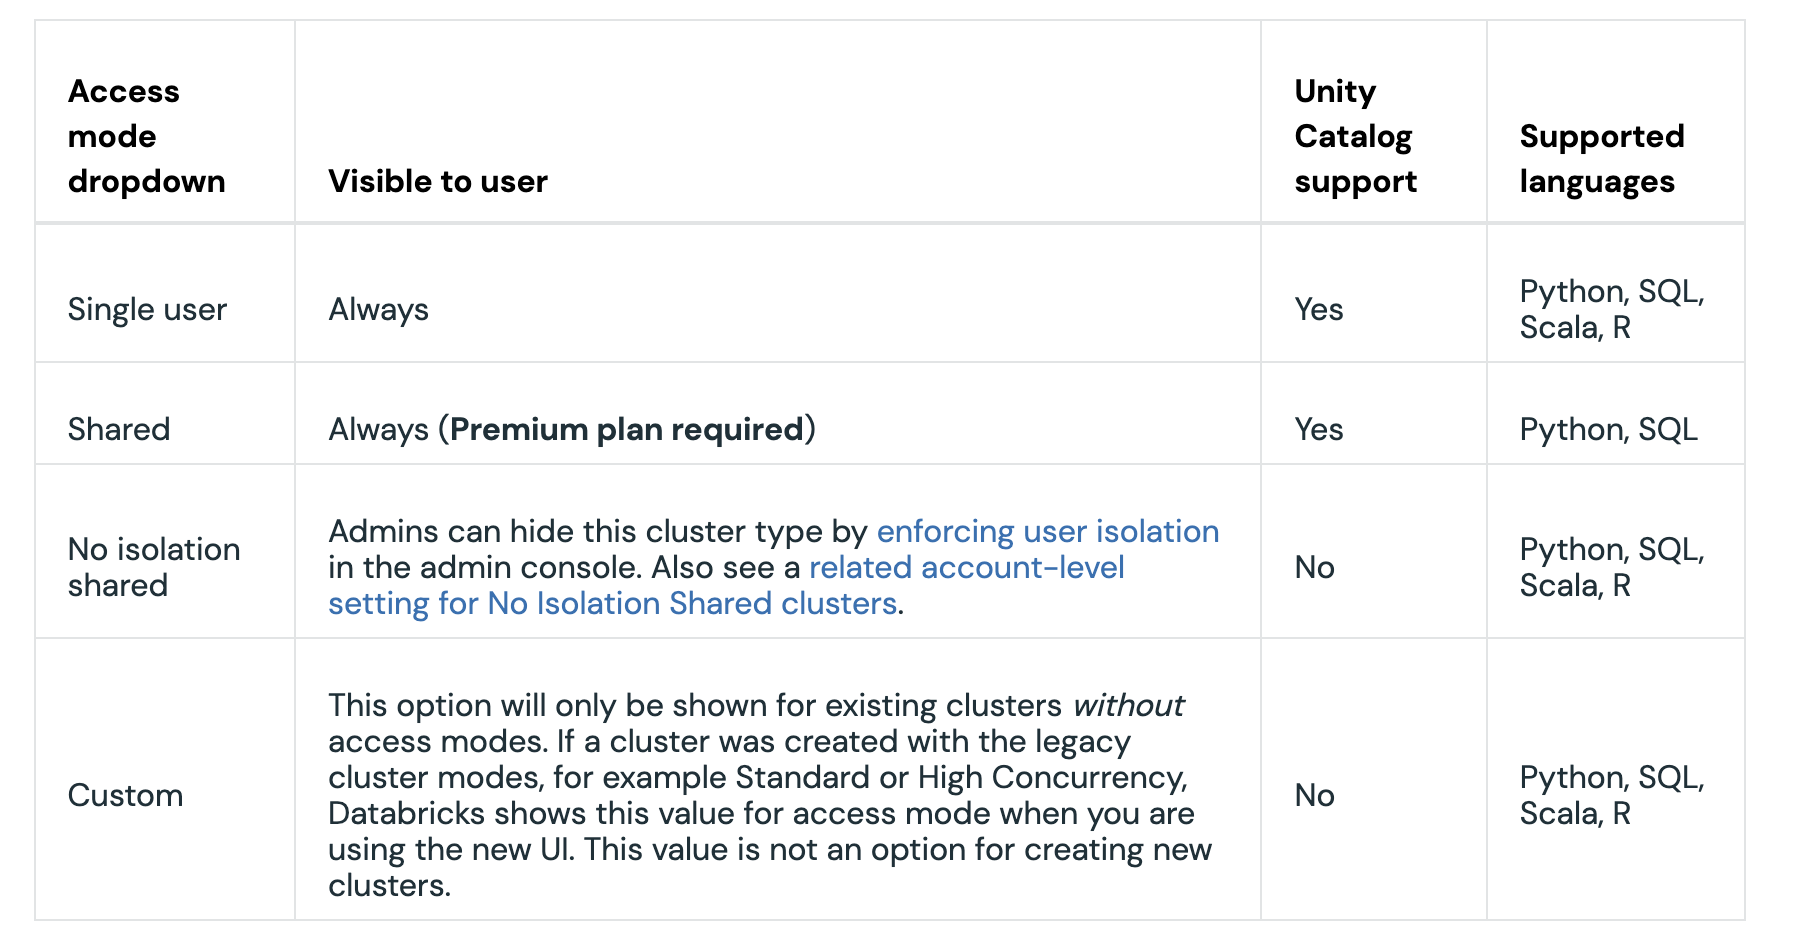
Create a cluster | Databricks on AWS
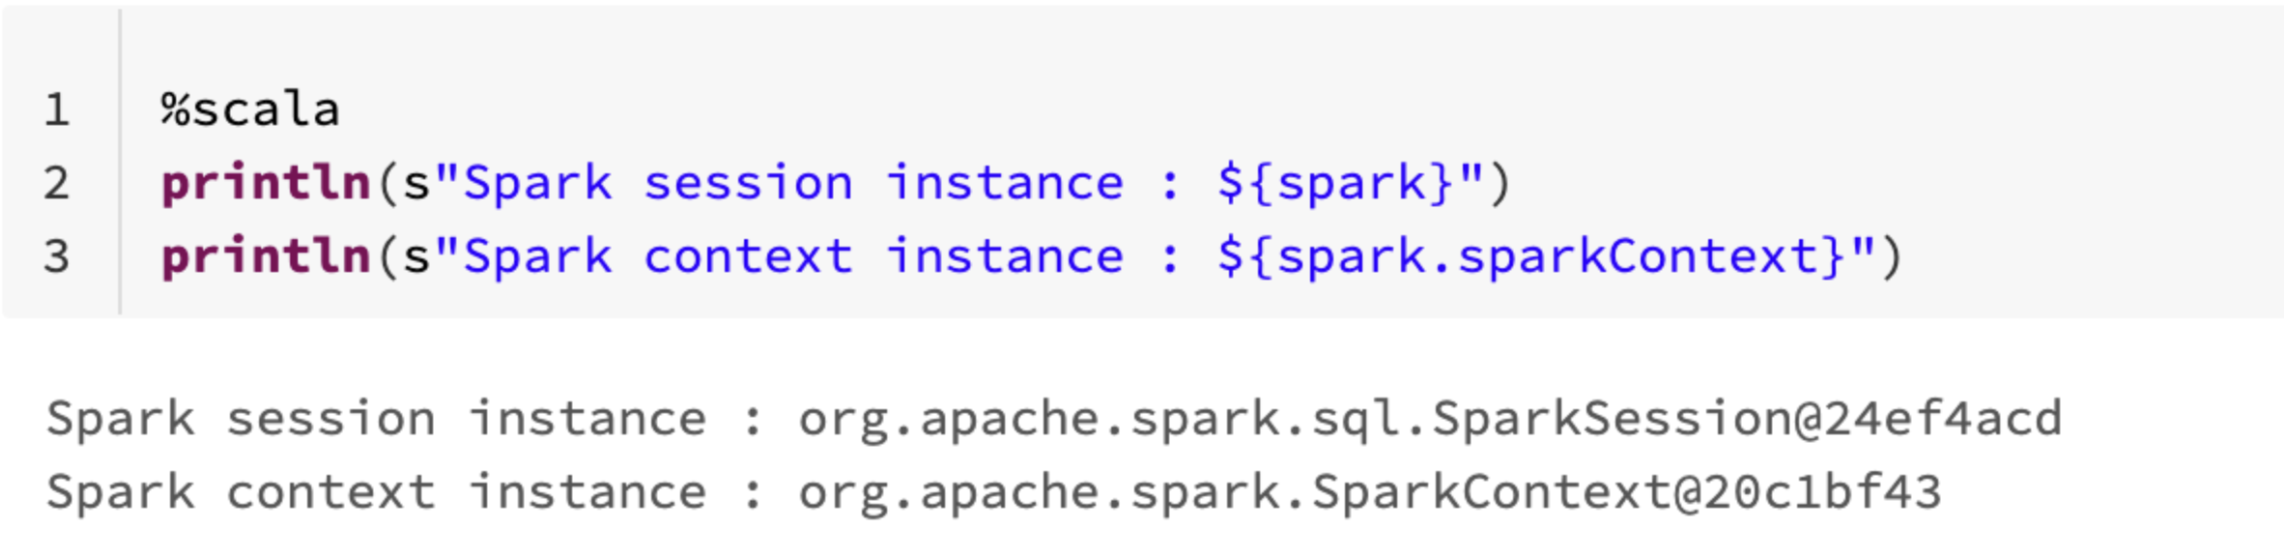
What you need to be aware of here is that in No isolation shared mode, Spark context will be shared among all users on the cluster. You can have a look here for more details on the difference between SparkSession and SparkContext. The SparkSession is safe to modify with things like custom configuration values like spark.sql.shuffle.partitions. That would not impact other users on the cluster. Every user gets their own SparkSession instance, but all users share the same SparkContext. For example, if you clear all persisted DataFrames/RDDs using SparkContext, that will impact other users on the same cluster.
To visualise what we mean by the above, here is a snippet of code showing SparkSession and SparkContext instances and their memory address running under my account on a No isolation shared cluster.
The following is the same snippet but was done by a colleague on the same cluster.
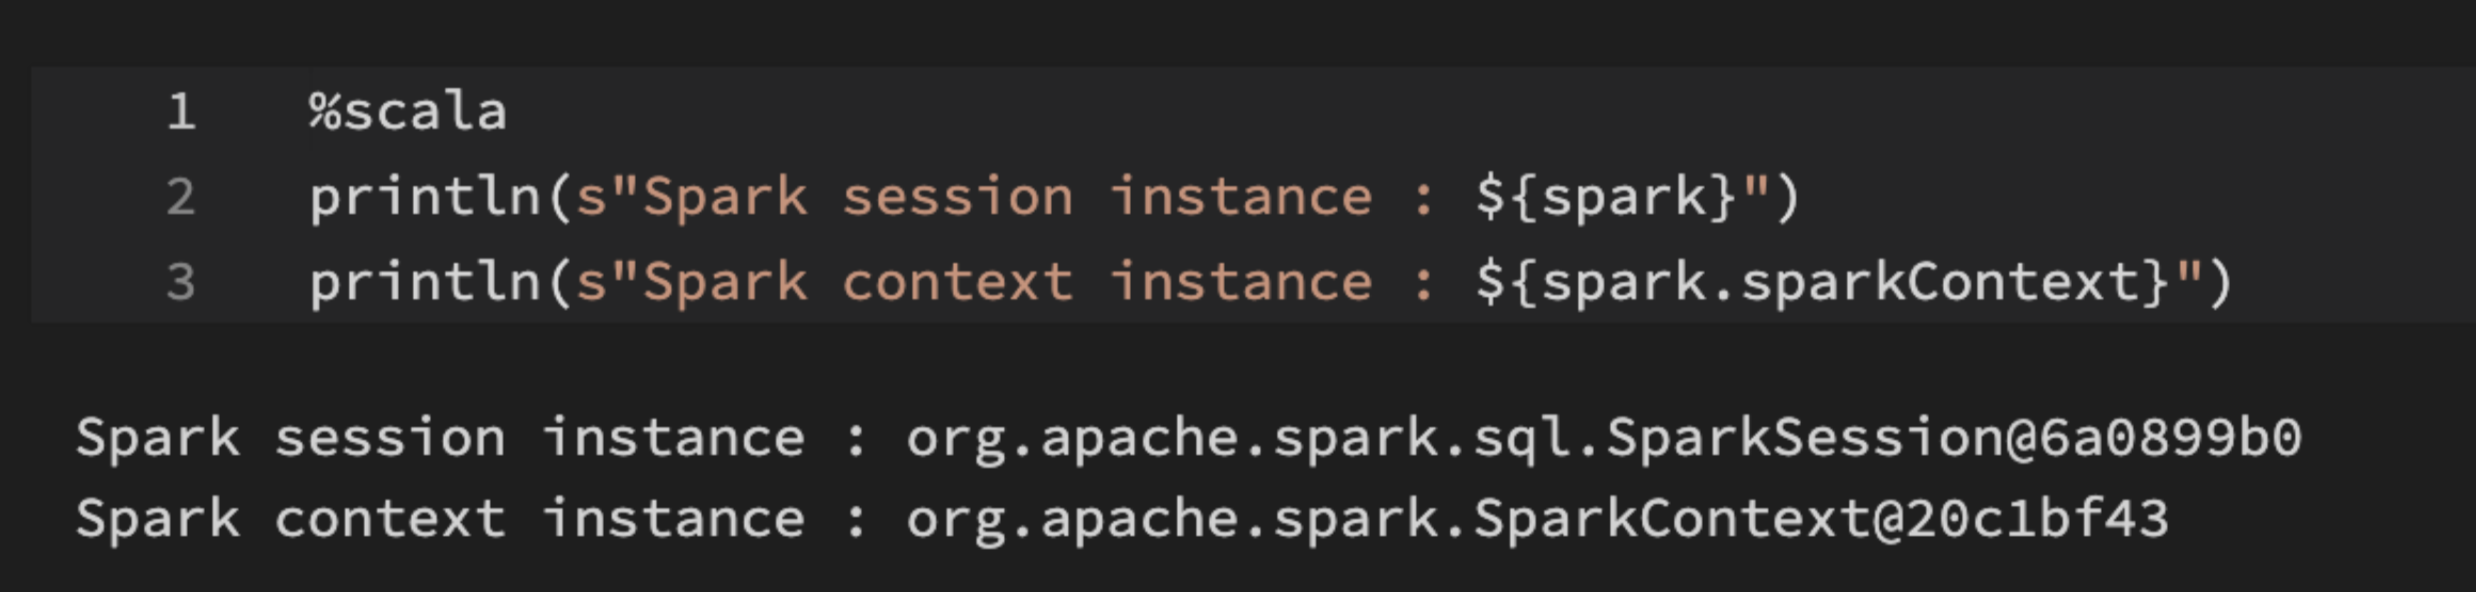
Other than dark vs light mode, SparkContext points to the same memory address for all users while each user gets a different SparkSession instance.
Init scripts
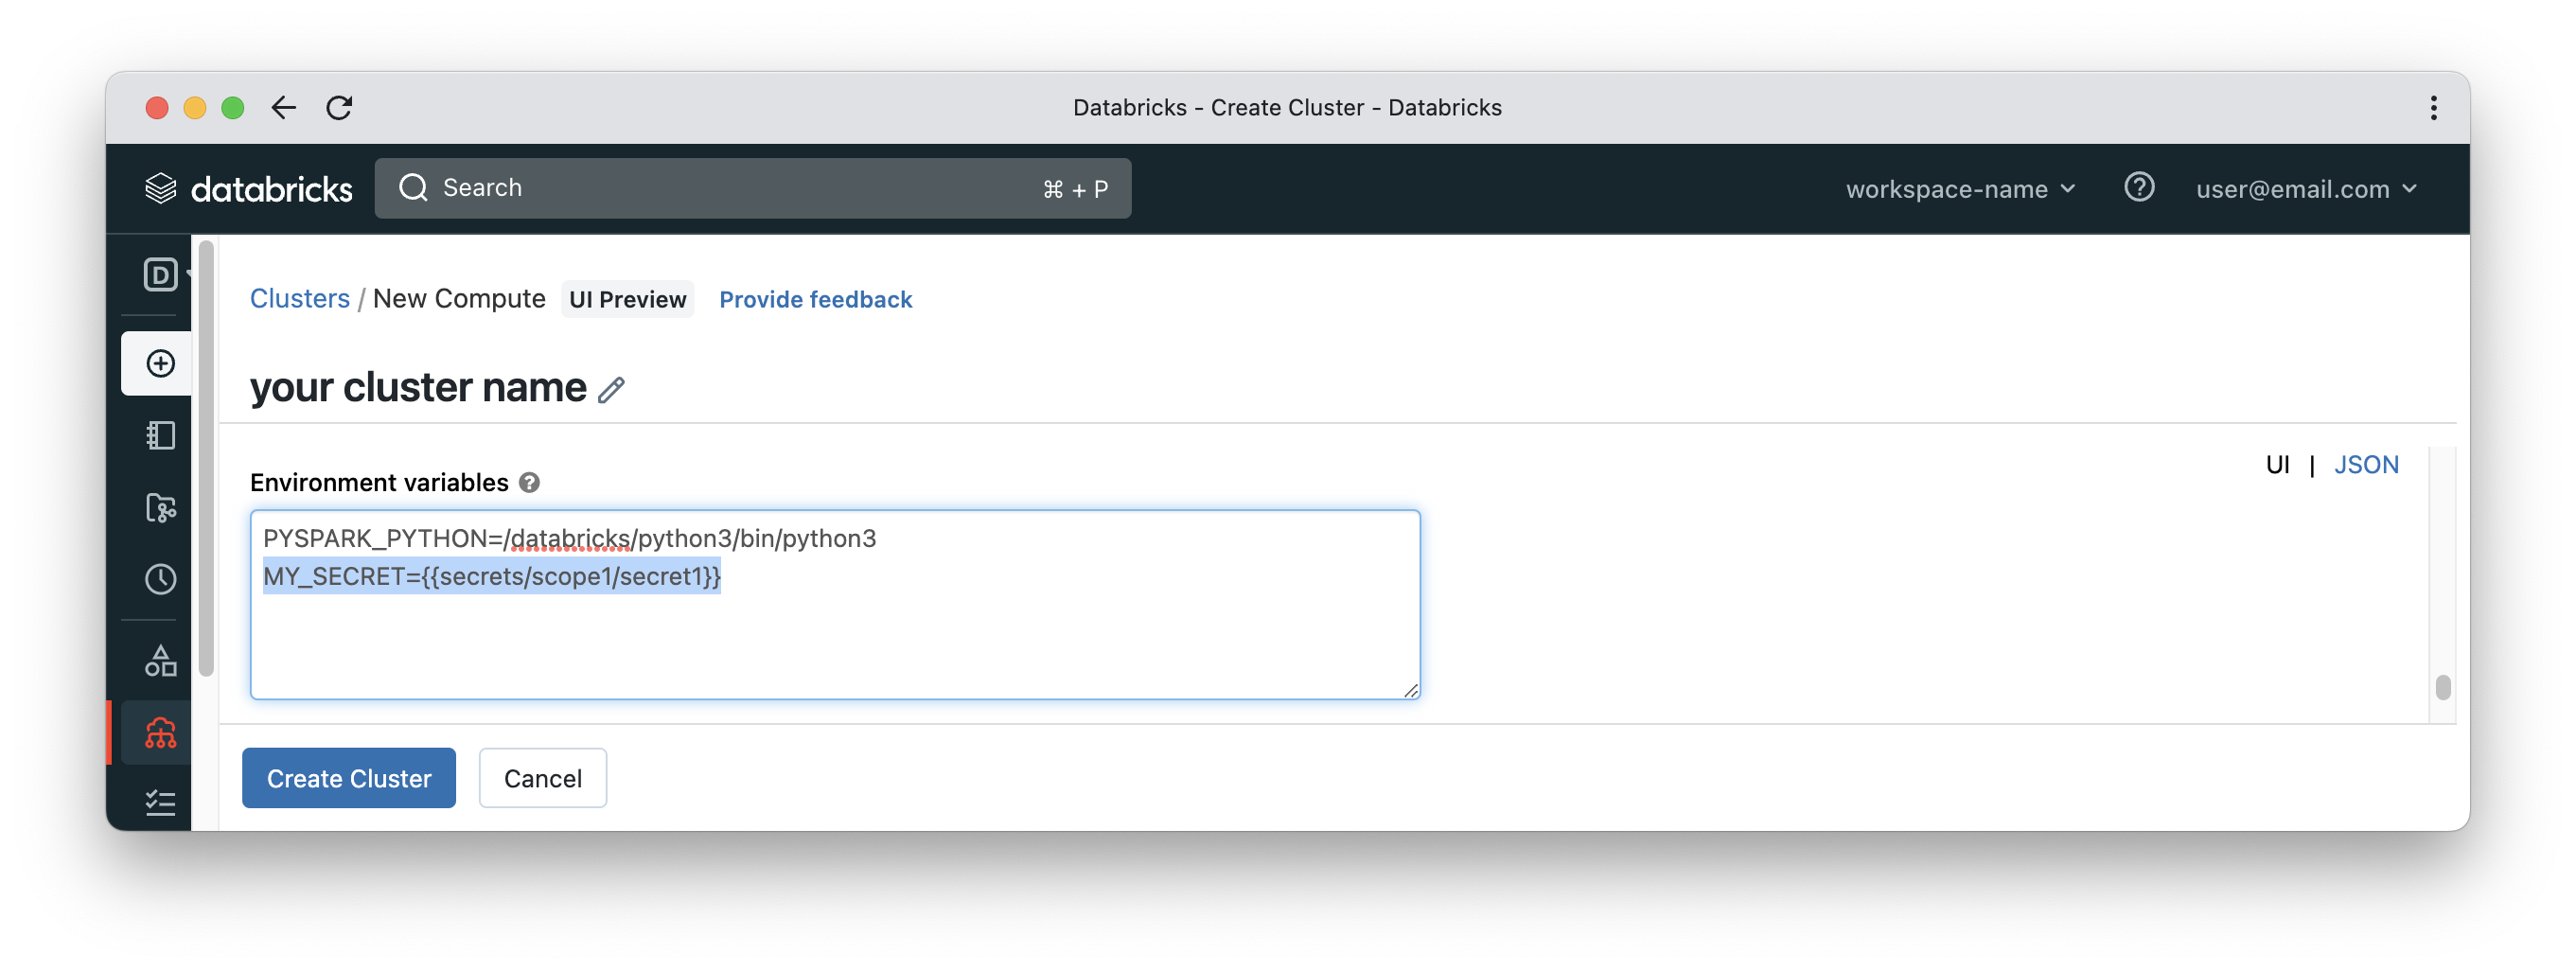
Clusters can have init scripts which are scripts that run after the cluster nodes are provisioned but before the cluster is made available to run jobs. Init scripts can be scoped per cluster or applied globally on a workspace level for any cluster within the workspace. Init scripts can install specific global libraries or do some bootstrapping like wiring Databricks with a monitoring tool like DataDog.
Secrets can be accessed inside init scripts by defining them as environment variables in the cluster configuration. Please make sure that any cluster exposing secrets as environment variables is accessible to the right group of users.
Docker services
It’s not something that would be commonly used but still good to know. Databricks clusters are based on docker containers running Linux OS. That’s totally fine for most cases but there could be a case where more control is required on how to build and configure such docker images. Databricks gives its customers the option to customise such images. The image can be built starting from a base image provided by Databricks or following a complete “build your own image” approach. See Docker Services docs for more details.
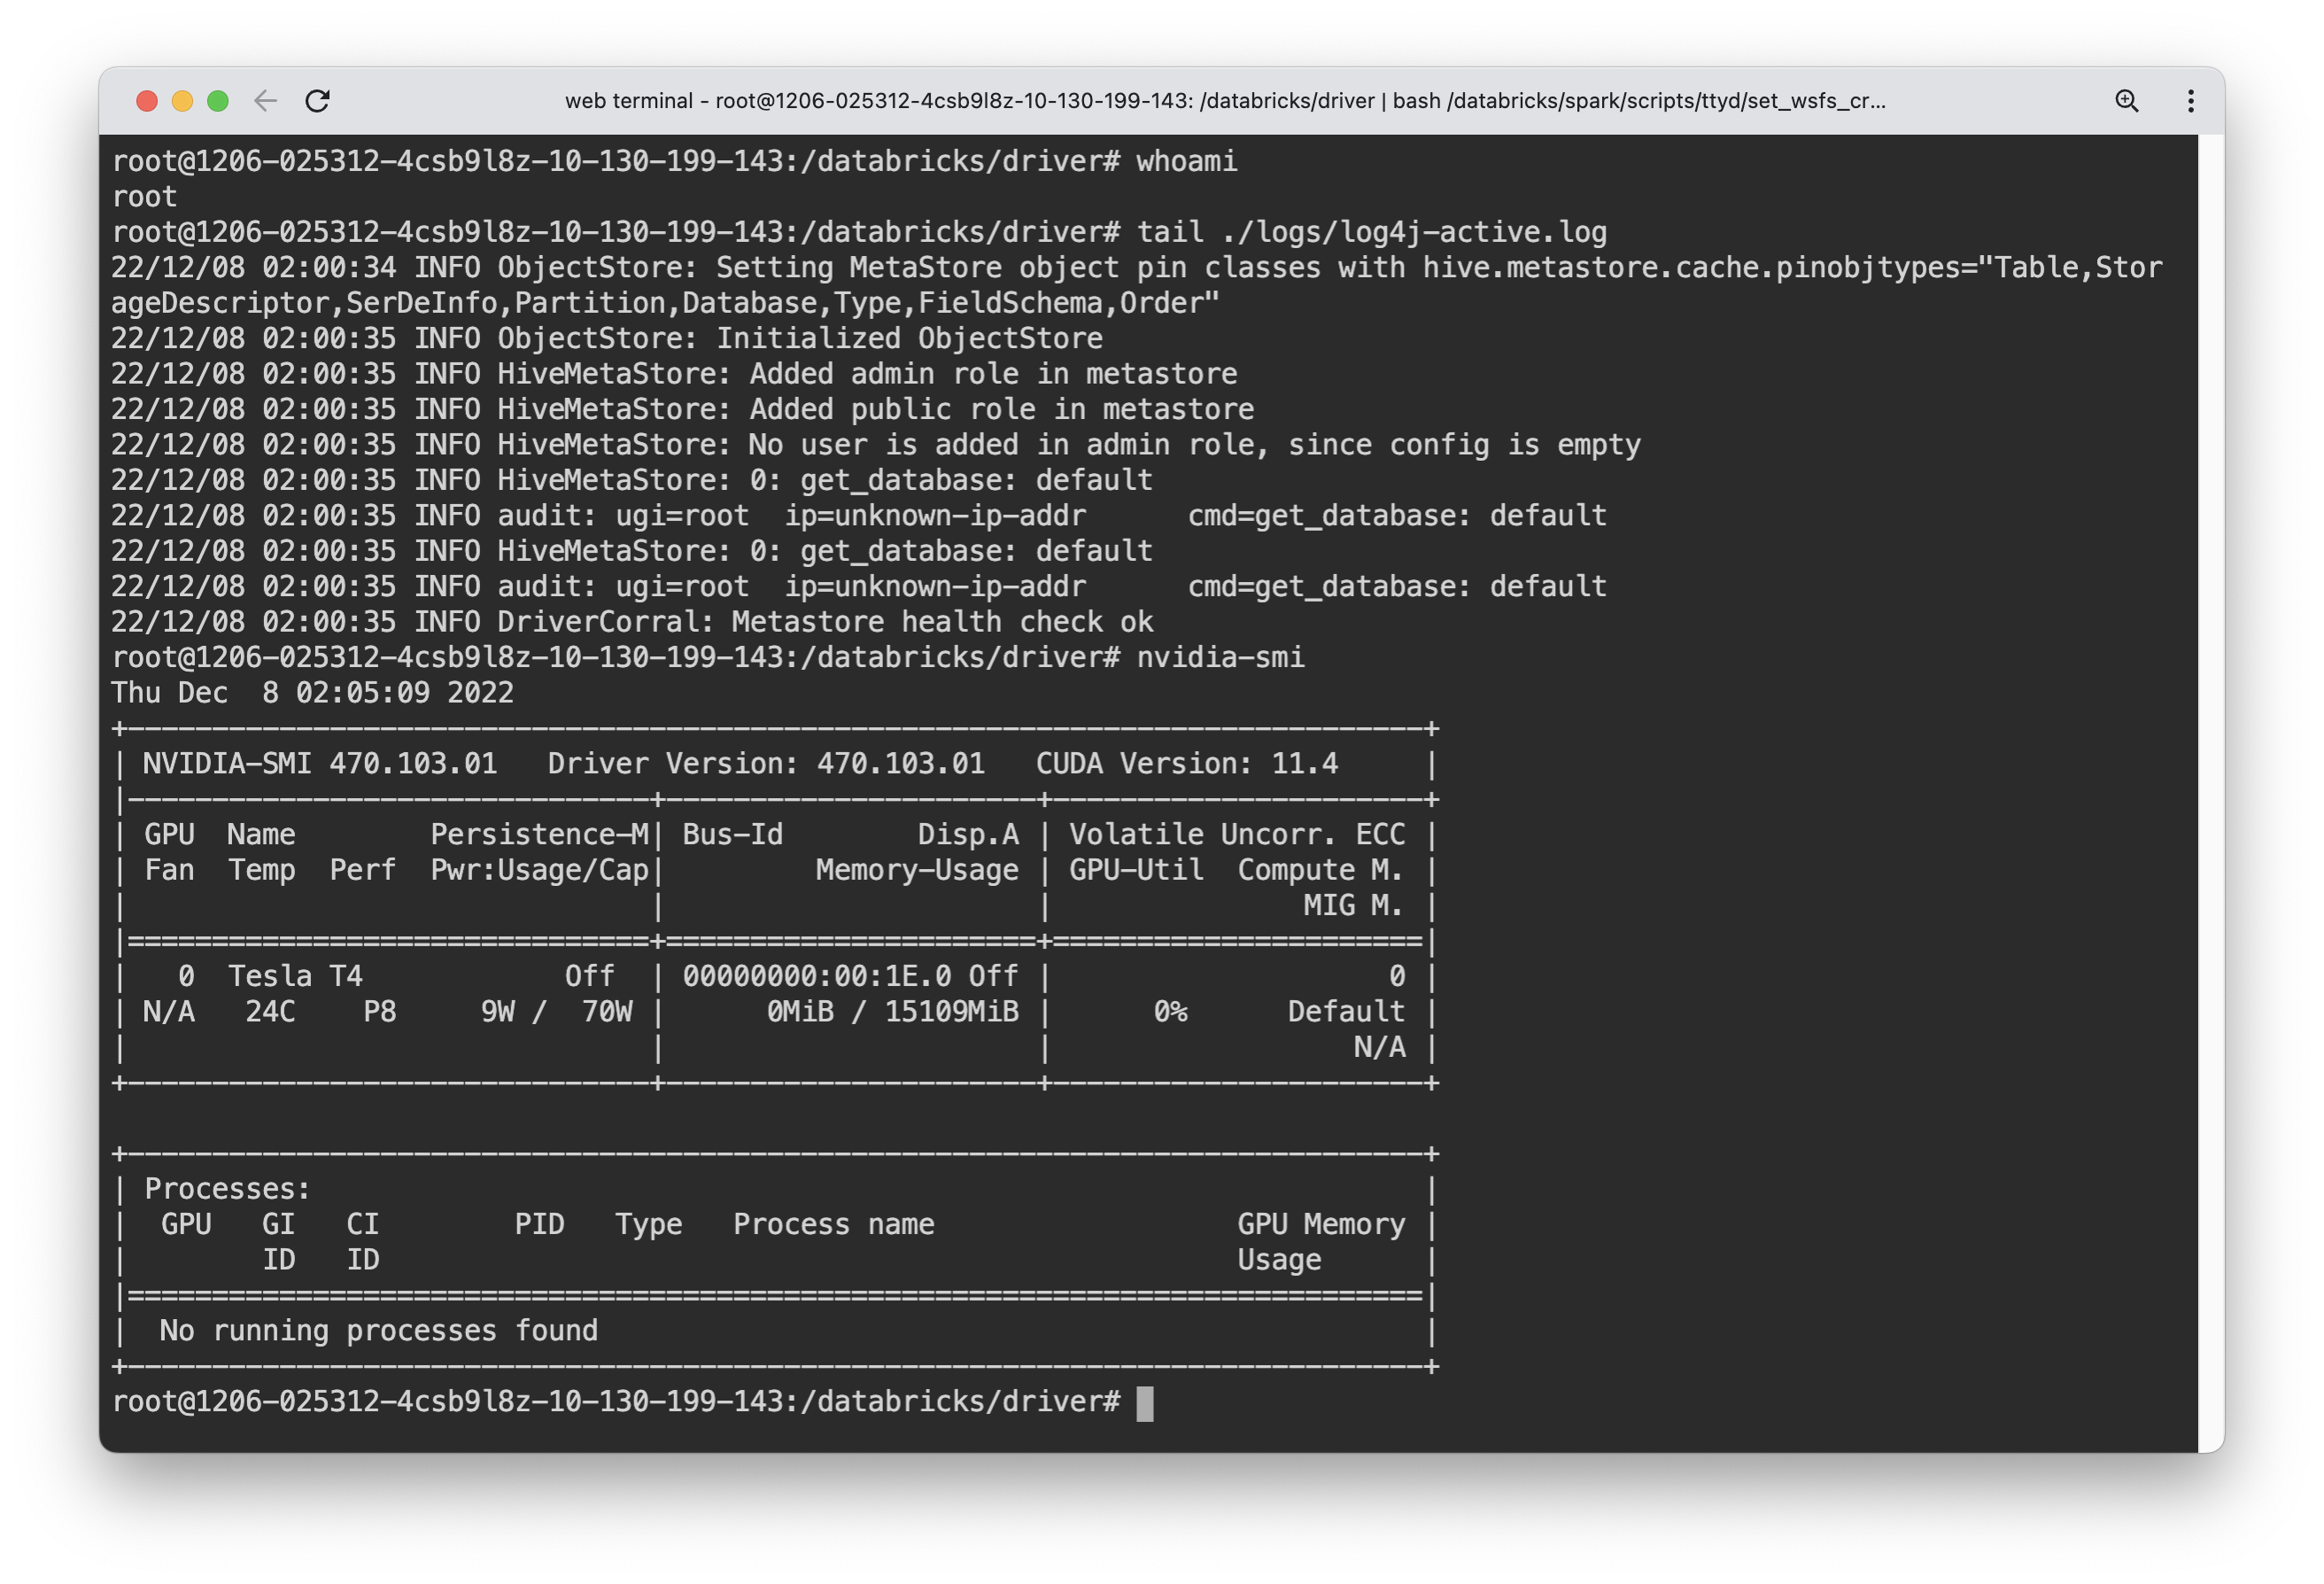
Web Terminal
Databricks provide a web console to tunnel into the driver node of a cluster using SSH. Although there is a shell magic command available in Databricks notebooks (%sh), web terminal is much more suitable for the following cases:
- SSH into workers from the driver node. This could help with advanced troubleshooting cases.
- Run tools like htop on driver or worker nodes, which cannot be done in a notebook.
- Edit any config files locally on cluster nodes using tools like nano.
- Machine learning clusters normally have workers with GPUs. In such instances, GPU utilisation is one important thing to check using tools like nvidia-smi.
Monitoring and Diagnostics
Monitoring and diagnostics are critical components for any mission critical product like Databricks. While Databricks has its own auditing/diagnostics features, there are lots of 3rd party tools that can integrate with Databricks and provide extensive options on top of logs collected from Databricks. Some of the tools in such space are:
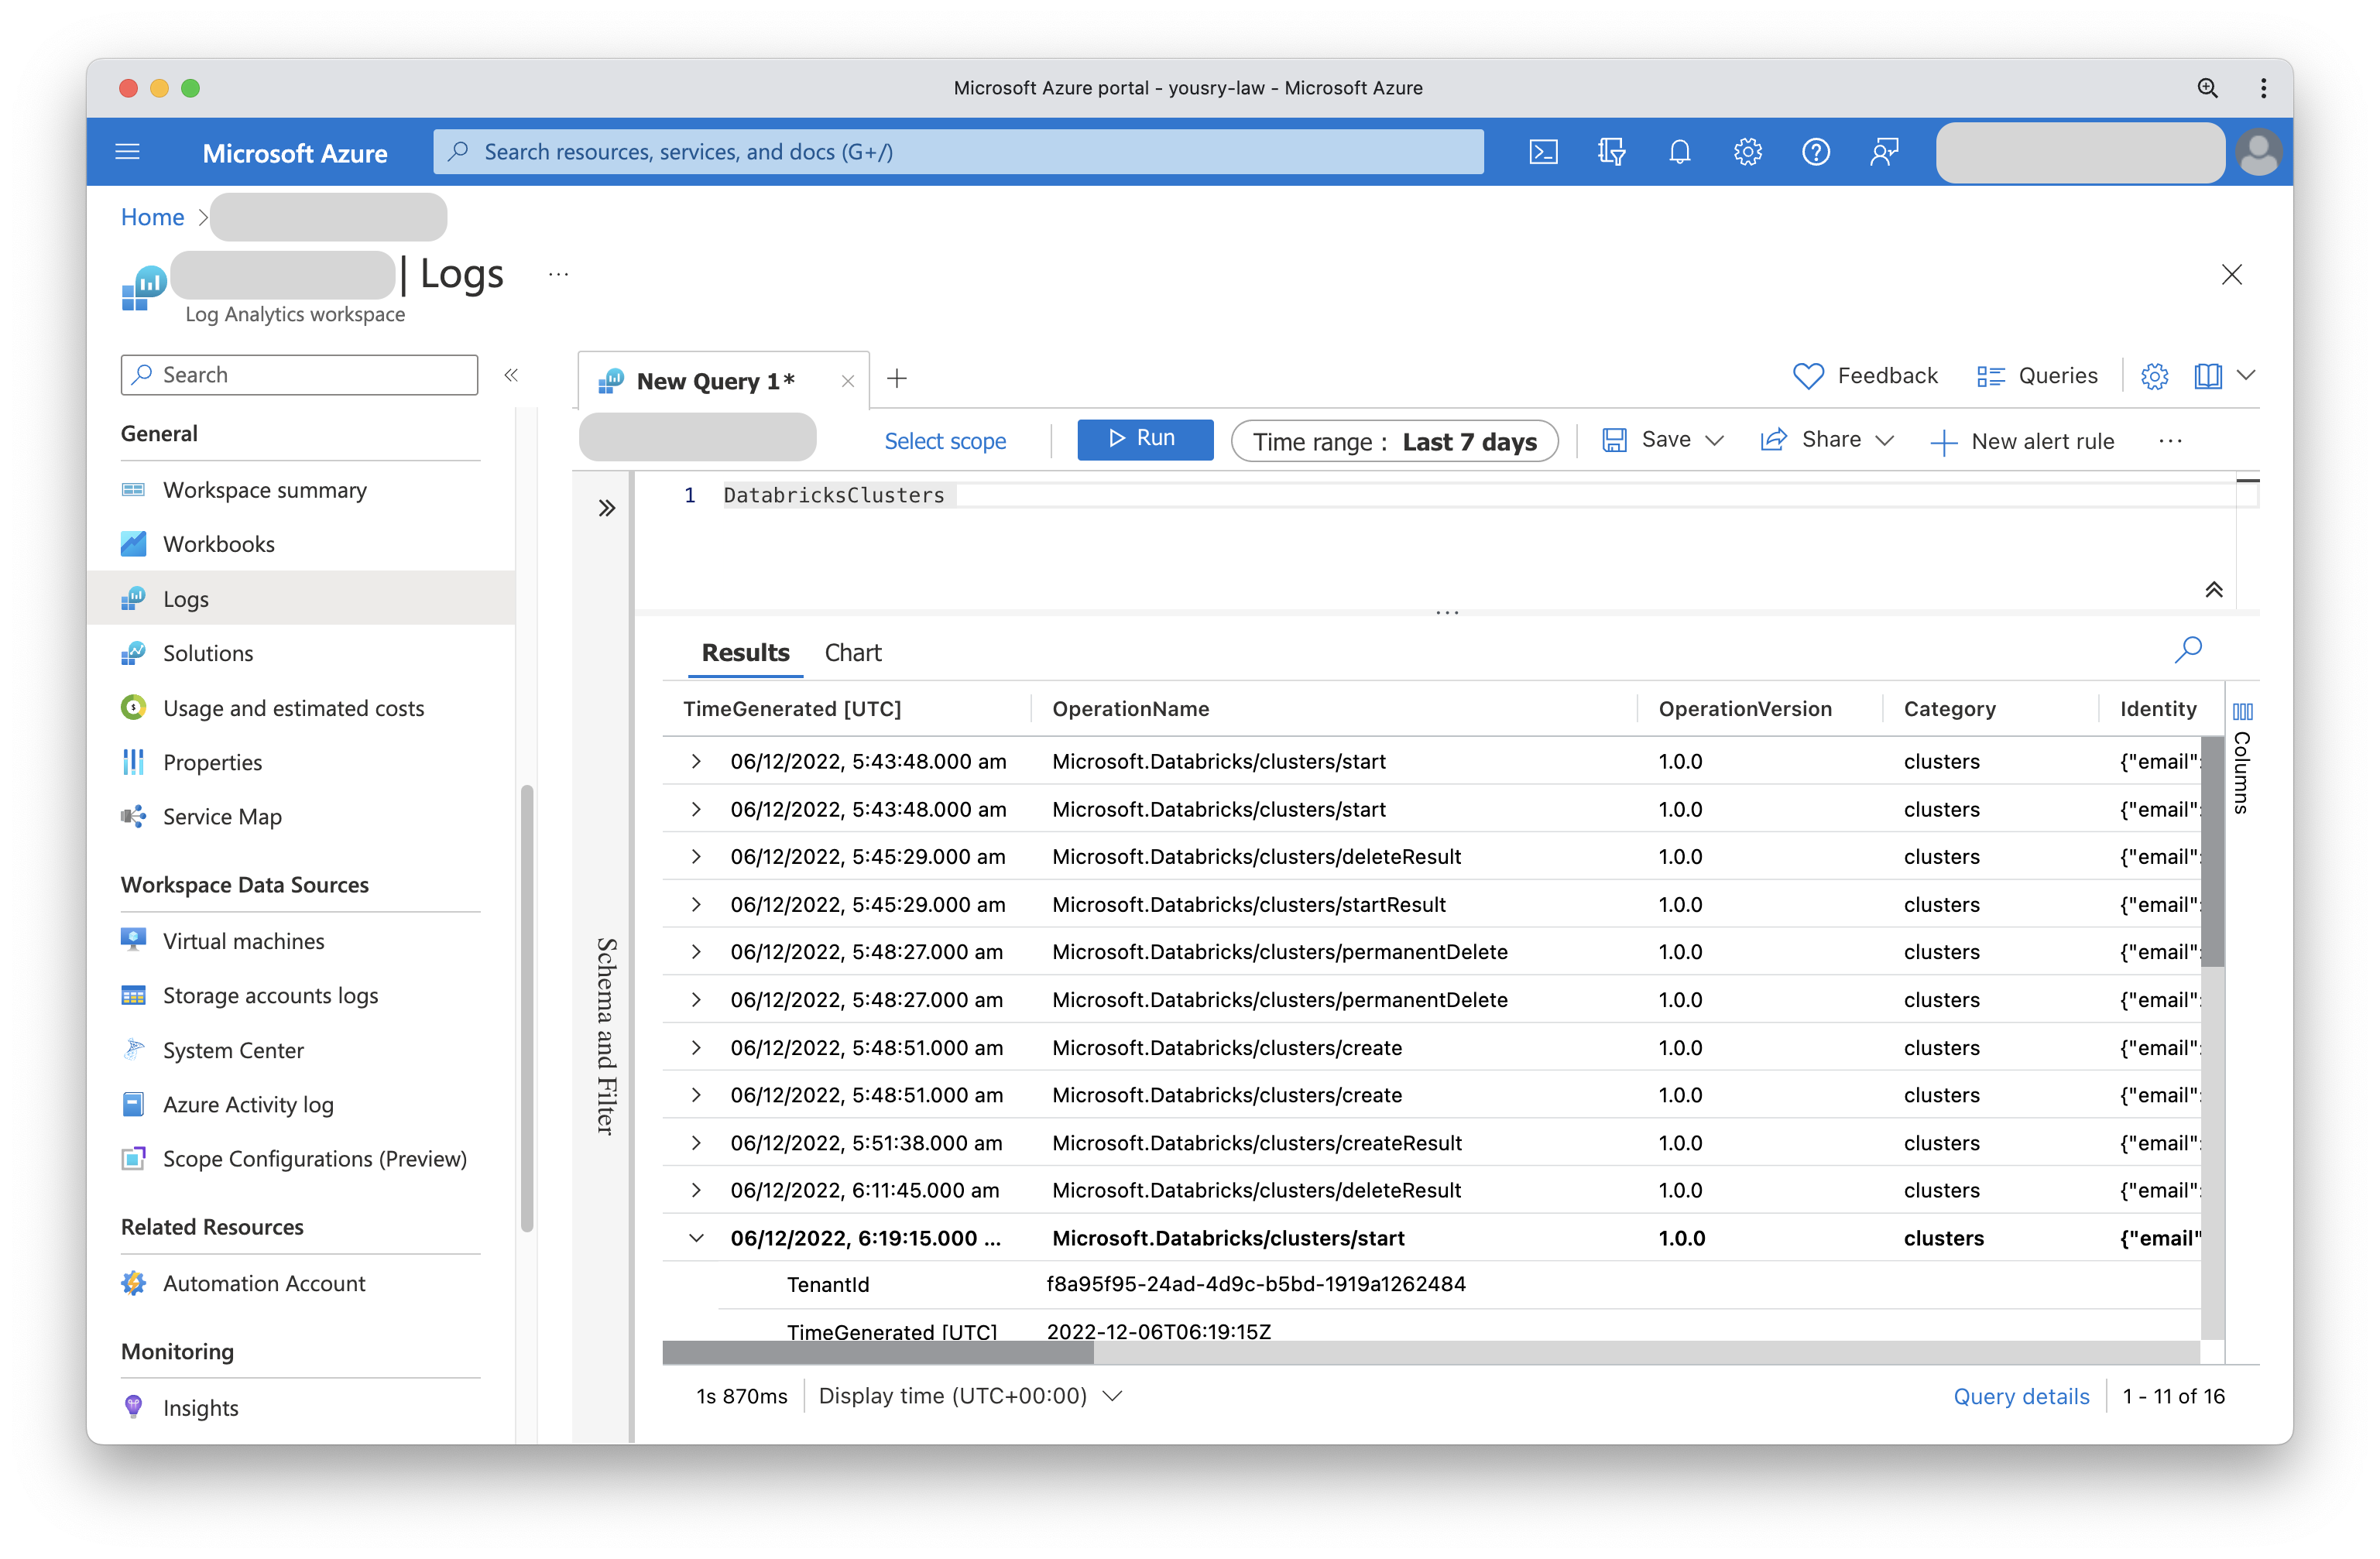
- Azure Log Analytics Workspace
- Amazon CloudWatch
- DataDog
Tools like Azure Log Analytics provide sophisticated methods of querying the collected diagnostics/audit data. In Azure Log Analytics Workspace, a query language called KQL is used to pinpoint a certain pattern in the logs. Also dashboards are another option to visually inspect the health and operation of a certain Databricks environment. Alerts is another tool in the arsenal to proactively be aware of any issues or unusual behaviours.
Conclusion
We barely scratched the surface of Databricks as a platform but the discussed topics cover enough ground to boost your productivity with Databricks.
Enjoy your data journey!
