INDUSTRY
Energy
SERVICES
Cloud Engineering
Data Science
Australia is a vast country. From the sprawling metropolis with the highest living standard on the planet to the isolated rural settlement cut off from any power grid or network — Australia has it all. This wide range of environments makes it a challenge to maintain or upgrade infrastructures like the electricity or gas network.

Reading meters today
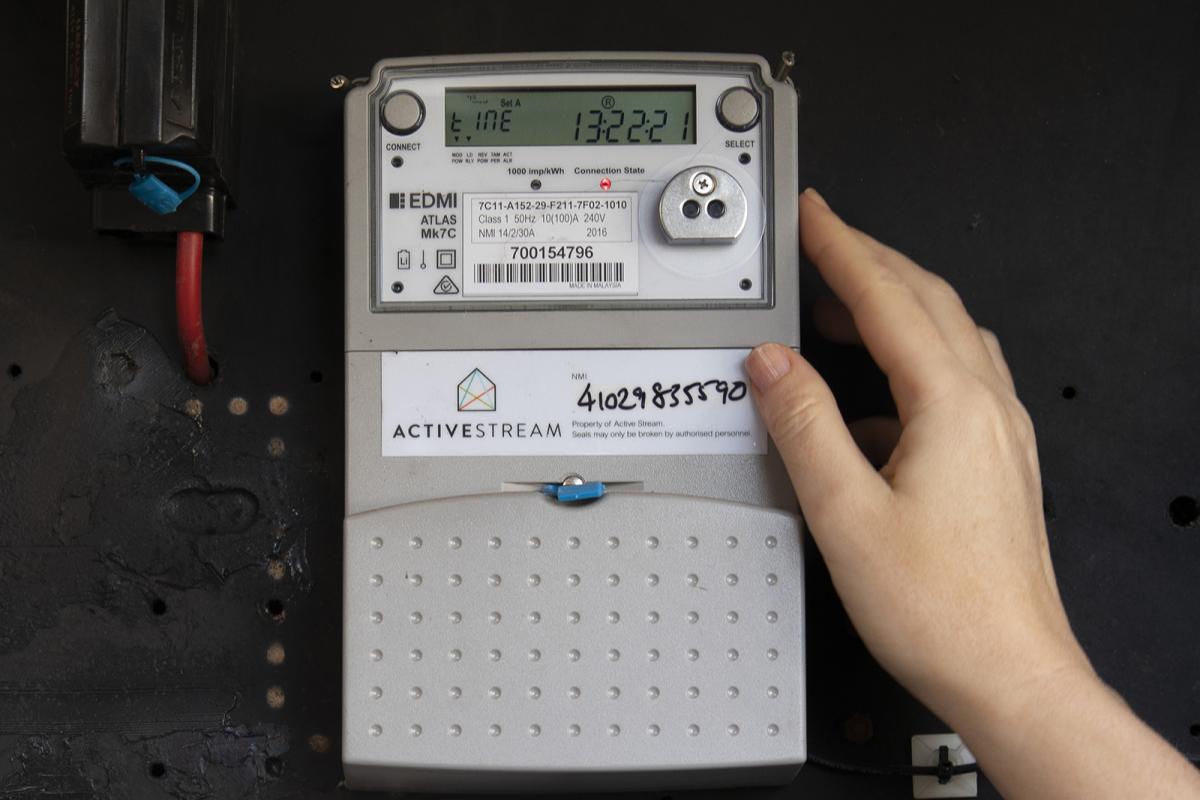
Some states, like Victoria, are ahead of the curve with mandated upgrades and have already phased out analog electricity metering devices. All electricity meters in Victoria are digital smart meters that can collect more than just the reading of the energy consumption and often connect directly to the provider via the Internet of Things, providing usage data every 30 minutes. Modern contracts that have pricing based on time of day, day of the week and more can be easily facilitated and measured with devices like this, a single device can record energy consumption along with a timestamp and the rest is worked out by computer calculation. The regular updates significantly reduce the chances for any discrepancy between the value billed for and the energy consumed.
However, Victoria is an outlier. In other states, the energy providers have to have physical access to the customer’s meter to read it. If the providers cannot read the customer’s meter, they provide an estimated bill. With the arrival of more extreme weather events in recent years in both summer and winter, these estimates can diverge from the actual consumption and frustrate the customer when they receive an updated bill with a higher value than expected. To reduce these sudden gaps, some energy providers have the option for customers to read their meter themselves and supply the reading to the provider to update the estimate to the correct value.
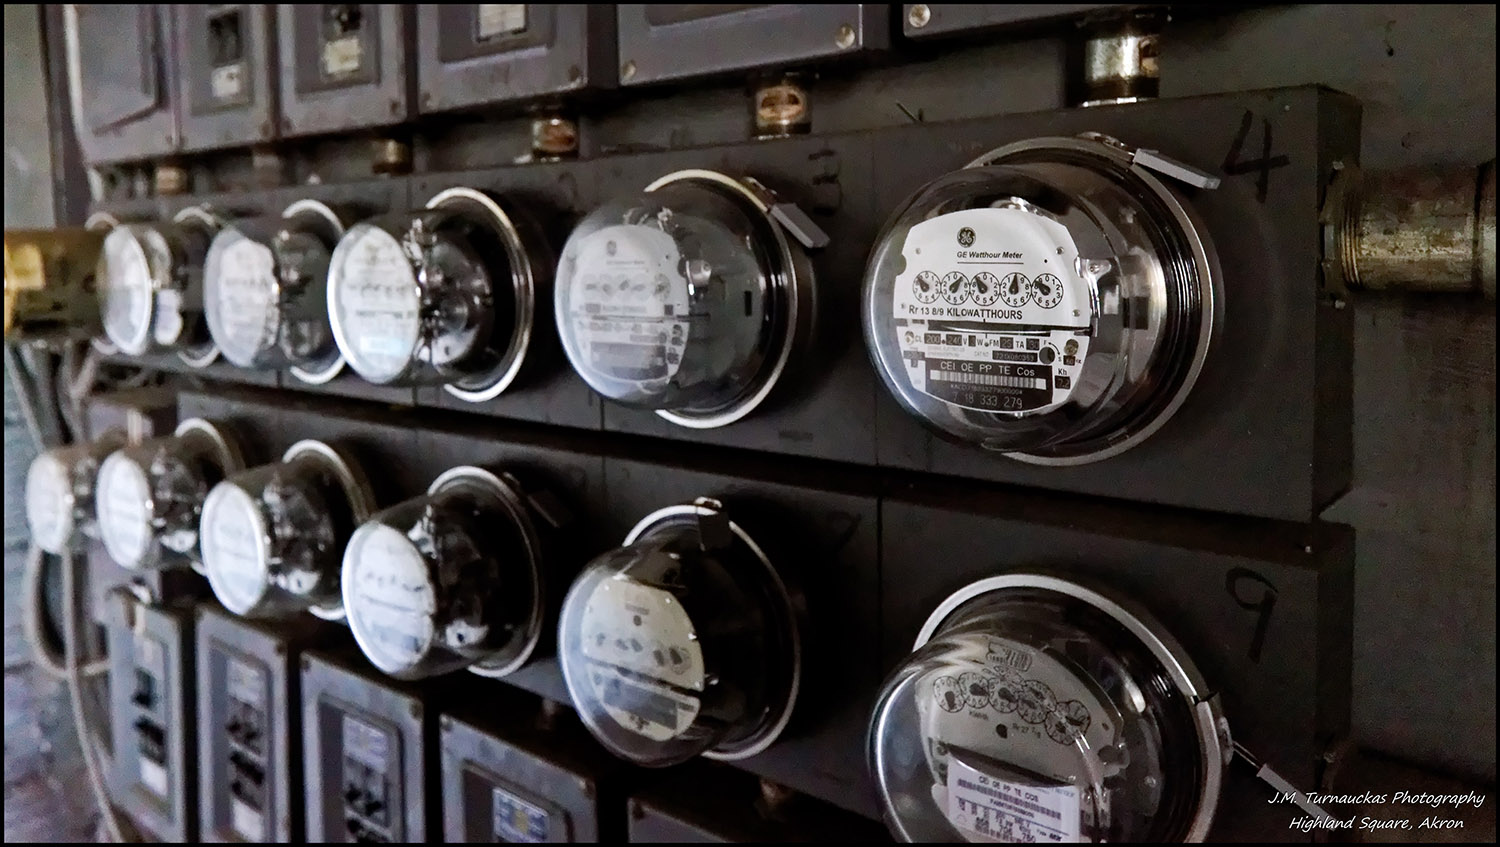
Unfortunately, reading analog gas and electricity meters is packed with challenges for the consumer. Even if the customer can identify which meter is theirs (see image below).

Typical meter array in an apartment block (CC BY 2.0 Mark Turnauckas Photography)
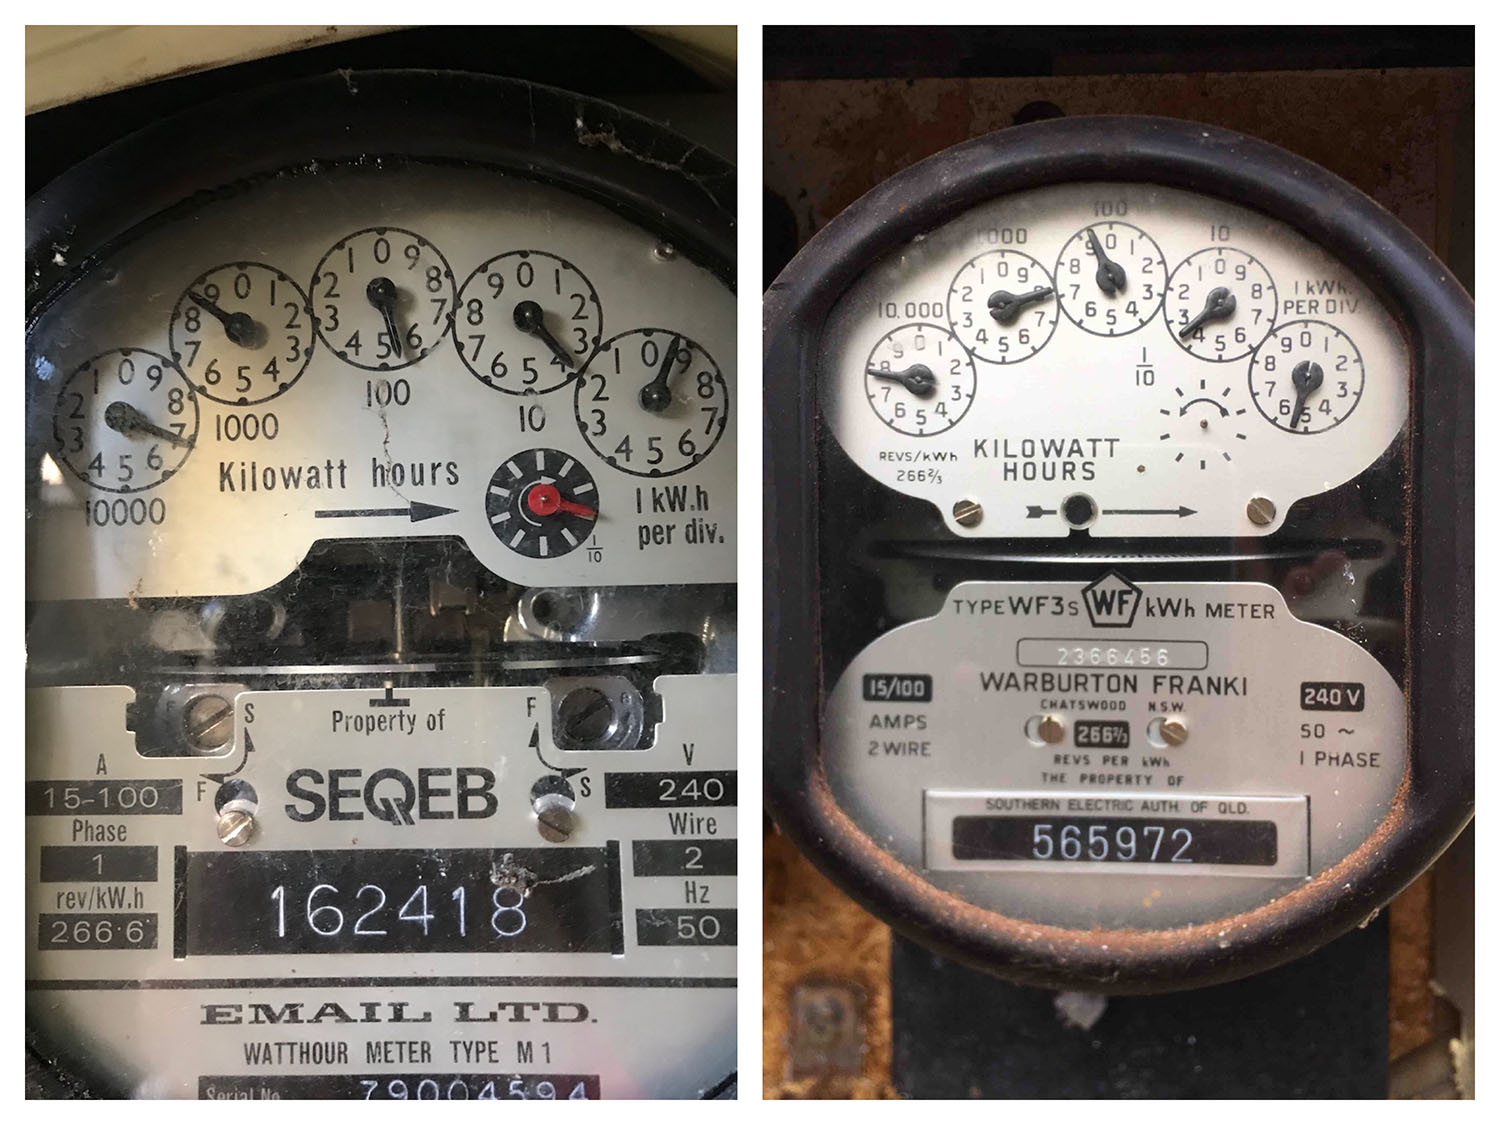
Knowing how to read the meter, how many digits are required and how this affects their bill can be near impossible for non-experts (try it yourself on the examples below!).

Meters are tricky. Can you spot the difference? (credit: AGL)
AGL approached us to find a way to improve the customer experience by giving the customer more control and information when they are reading their meters in a way they can easily use and understand.
The Project
AGL were looking for an application that would be a game changer for its customers — a solution that would enable an interactive meter read, in real time. The objective was to reduce unexpected bills as much as possible and give the customer more control over their energy consumption.
The initial project timeline had two stages: A Proof of Concept (POC) would determine the feasibility of a solution and, if completed successfully, lead into a field trial to test the tool ‘in the wild’.
The Challenges
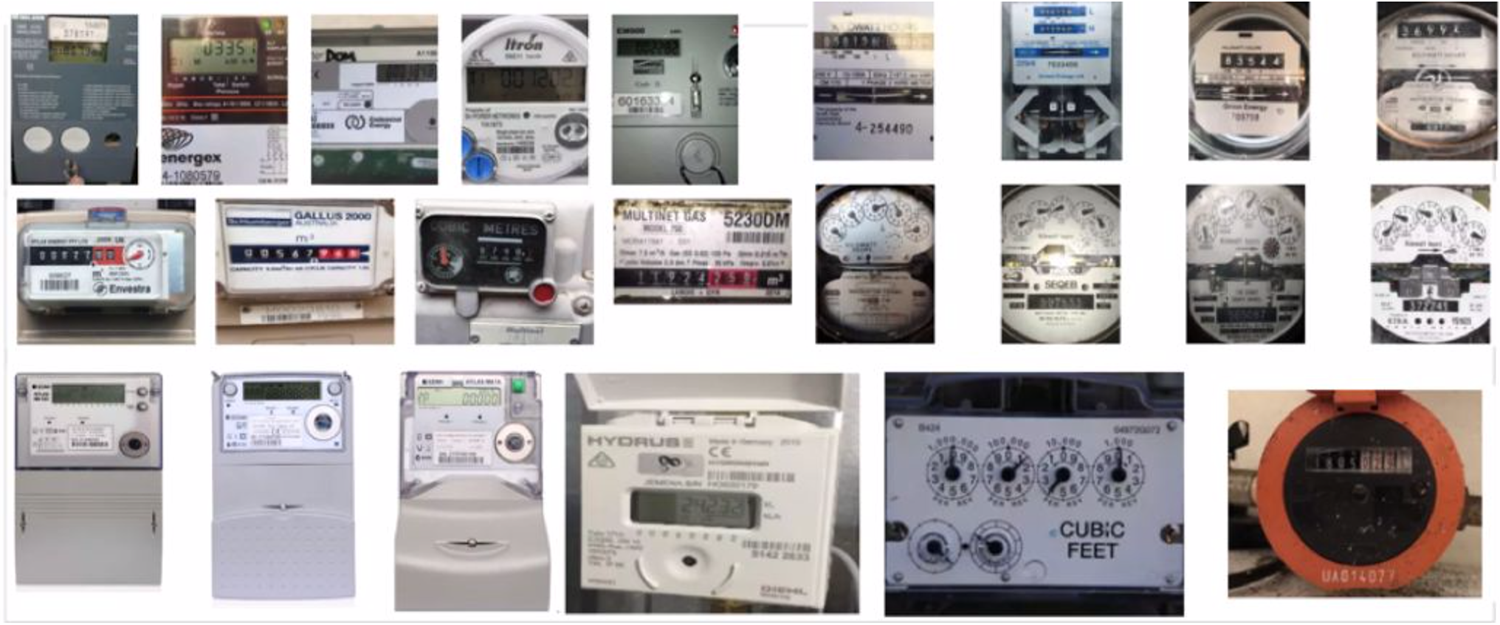
To begin finding a solution, we had to understand the problem space. The meters, both digital and analog, come in various makes and models:

A few examples of meter types and makes (credit: AGL)
AGL has a guide to help customers read their meters manually. These instructions divide the meters into four different groups for both electricity and gas meters. While this information gave us a starting point, we did not know much about the proportions of these groups among the meters in use and what challenges the individual types might pose.
AGL provided us with a large dataset of images from all groups of meter types which we had to classify manually in separate stages. Regular discussions with subject matter experts at AGL were invaluable to set priorities and identify pitfalls and opportunities in classifying and reading the individual meters.
The images supplied by AGL were a genuine reflection of the customers’ challenges and so it quickly became obvious that the analog electricity meters with clock faces were the most difficult to read. At the same time, they are the most ubiquitous non-digital model still in use. We therefore decided that the POC should demonstrate how the most complex and most widespread problem can be tackled successfully and focussed on developing a solution to identify all meters and read clock faced meters specifically.
It wasn’t just the meter read that needed to be captured through the app, it also had to locate the label on the meter that connects to the specific customer.
Furthermore, the app had to locate the region on the meter that would identify it in relation to the customer. This was especially important to help the customer manage the complexity of modern peak/off-peak contracts that require multiple analog meters to record power consumption for different times of the day.
We realised that due to the complexity of the problem space and the number of data labels we would require, we had to not only understand how to read the meters ourselves, we had to find ways to quickly teach large groups of people how to do the same to distribute the labelling process. The transfer of human knowledge and understanding into a machine readable format is still one of the most time-consuming and error-prone steps in the process of machine learning. A machine learning model will only be calibrated as well as the data it is trained with, and it is tempting to take shortcuts because the labelling task is repetitive and tedious to humans. We solved this problem in collaboration with AGL, having multiple short labelling sessions with a limited number of volunteers who focussed on an individual task or label type to speed up the learning process and minimise confusion and risk of error.
The Solution
Given the target of an interactive, real-time application on a mobile platform, we decided to use the live camera output of the phone as an input stream of images for the app to read sequentially. This greatly improved the app’s resilience to glare, reflections or other effects that could make a single image unreadable.
The objects we wanted to detect were very complex, so we chose to divide the model into smaller, specialised subunits that would only be used if required. The first component of the architecture would therefore be an object detector model that identified elements of each frame and filtered out the relevant information to pass on to the specific subunit. A final logic would statistically evaluate the results from multiple frames in real time to reduce errors and produce a result with a detailed confidence value for each component.

A basic outline of the solution architecture to read clock face meters
We developed the initial POC as a mobile app on the iOS platform. From the beginning, it was our goal to not only provide AGL with a well developed technology, but also to enable AGL to maintain and upgrade the product on their own.
For implementation we chose to use Tensorflow as the machine learning framework. It is widely accepted and can be run on any platform, be it locally, on a virtual machine or with cloud GPU support in AWS, GCP or Azure. Our preferred machine learning cloud environment for this project was Google Cloud Platform, hosting our training data and training on Google ML Engine. Tensorflow also supports the ability to export to both CoreML and TensorFlow lite for applications on iOS and Android which secured the necessary compatibilities beyond the POC stage.
Another advantage of using Tensorflow was the range of pre-trained models available as part of the Tensorflow object detection API. Using a pre-trained version of a neural network optimised for mobile devices, meant we could quickly train and iterate through various versions of our object detector without having to completely start over every time.
Throughout the process, we documented the procedures, tools and techniques used for labelling, training and model deployment and met several times with the internal data science team at AGL. It was important for us to keep the client informed of our progress as well as sharing our reasoning behind choices for design, architecture and tooling. AGL’s data science team were very receptive of our continuous involvement and greatly impressed by the capabilities and portability of the Tensorflow approach.
Results
The goal to increase the customer’s control over their power bill provided us with a straightforward metric: measure the accuracy of the meter reader in actual dollars. This had the added advantage that the metric was relatable for both developers and stakeholders.
- The field trial had a sample size of more than 300 measurements and 74% were within a range of modest deviation of $5
- The region linking the meter with the customer was found in more than 99% of the images.
- The average time to take these measurements was 5–6 seconds, less than half the time taken by an average human reader.
This is a great result for a proof of concept and a field trial. Not only did we develop a standalone app that holds great promise of increased control and insight for AGL’s customers, we discovered various possibilities of further improvement and increased performance during our trials.
This prototype has the capability to give both AGL and its customers a more valuable, real time insight into gas and energy consumption and provide more control for better pricing as well as conscious spending and saving money.